Fig. 2
Download original image
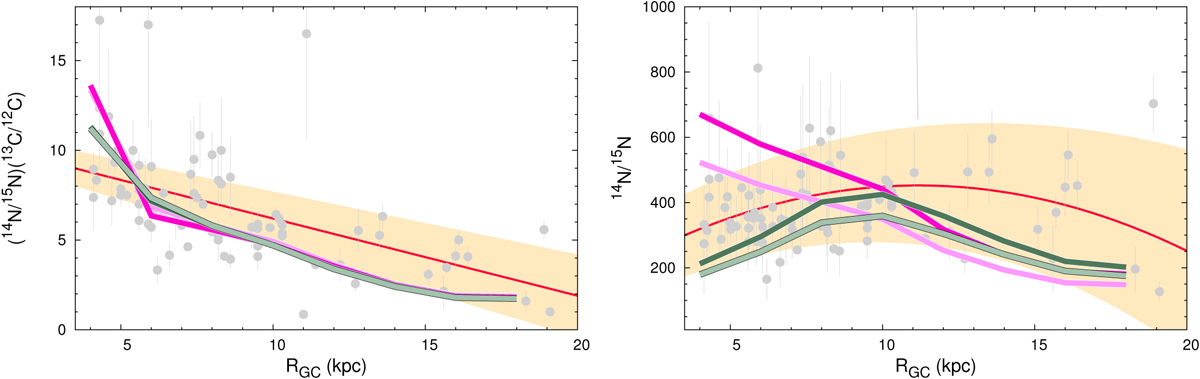
Isotopic ratios predicted by GCE models. Left panel: comparison between the (14N/15N)×(13C/12C) ratios derived from observations and predicted by GCE models. The red line and light orange regions are the same as in Fig. 1. Right panel: same as the left panel, but for the 14N/15N ratio. In both panels grey points correspond to the observed star-forming regions. The dark green, light green, magenta, and pink lines are the predictions from GCE models (see Sect. 4 and Table 2). Note that in the left panel the dark green model is below the light green one.
Current usage metrics show cumulative count of Article Views (full-text article views including HTML views, PDF and ePub downloads, according to the available data) and Abstracts Views on Vision4Press platform.
Data correspond to usage on the plateform after 2015. The current usage metrics is available 48-96 hours after online publication and is updated daily on week days.
Initial download of the metrics may take a while.