Open Access
Fig. A.2.
Download original image
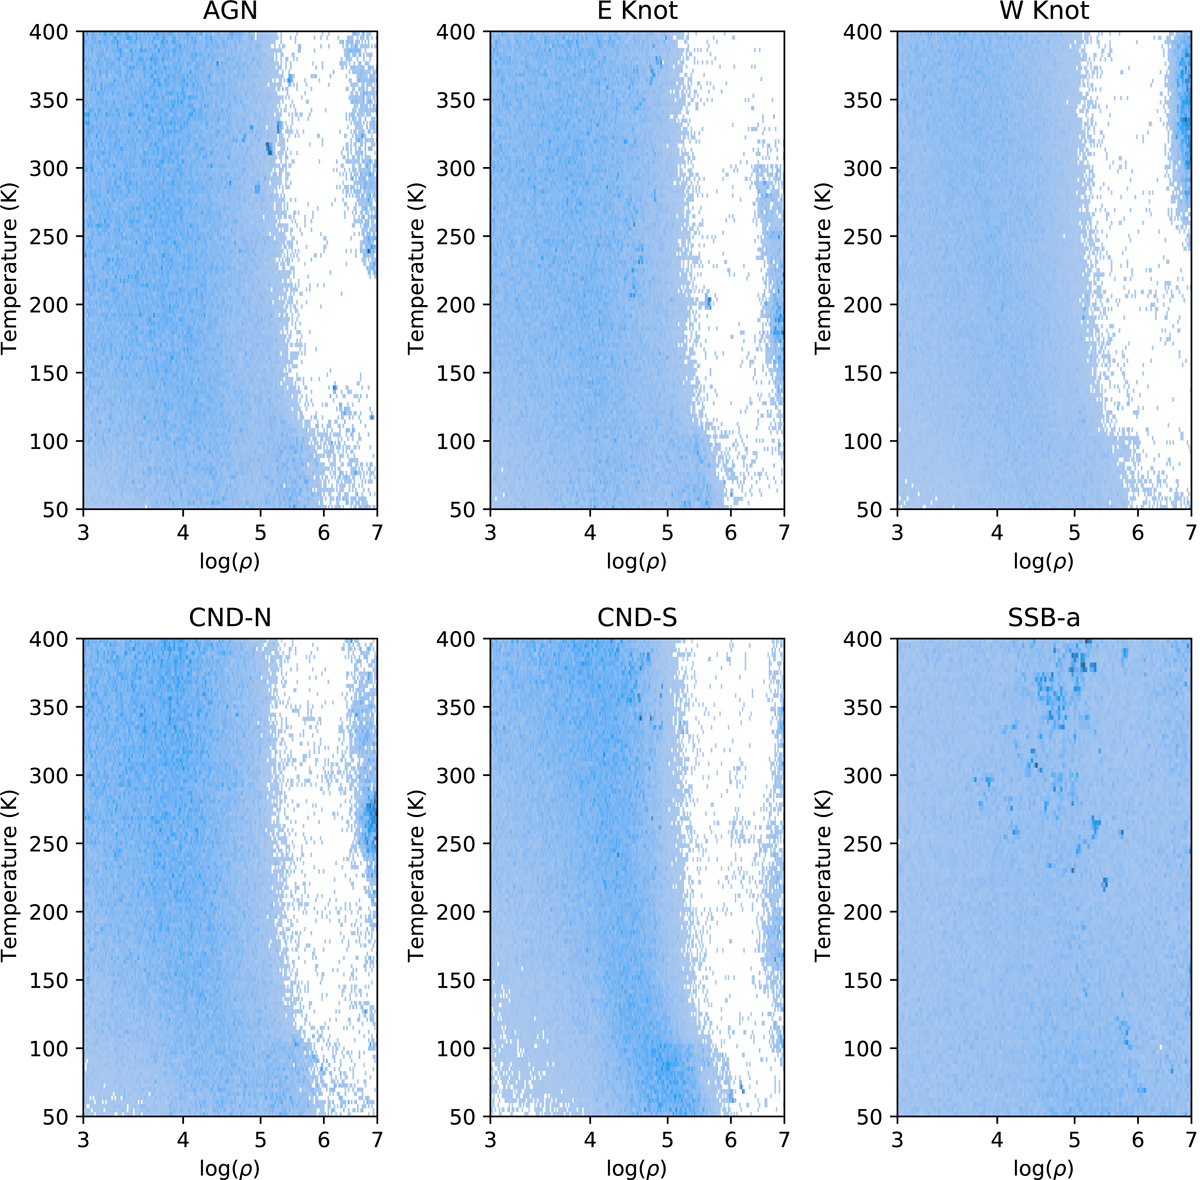
Resulting joint posterior distributions for temperature and density as produced for the lower resolution (∼100 pc scale data) for the six regions that have enough ratios to fit, at this lower resolution.
Current usage metrics show cumulative count of Article Views (full-text article views including HTML views, PDF and ePub downloads, according to the available data) and Abstracts Views on Vision4Press platform.
Data correspond to usage on the plateform after 2015. The current usage metrics is available 48-96 hours after online publication and is updated daily on week days.
Initial download of the metrics may take a while.