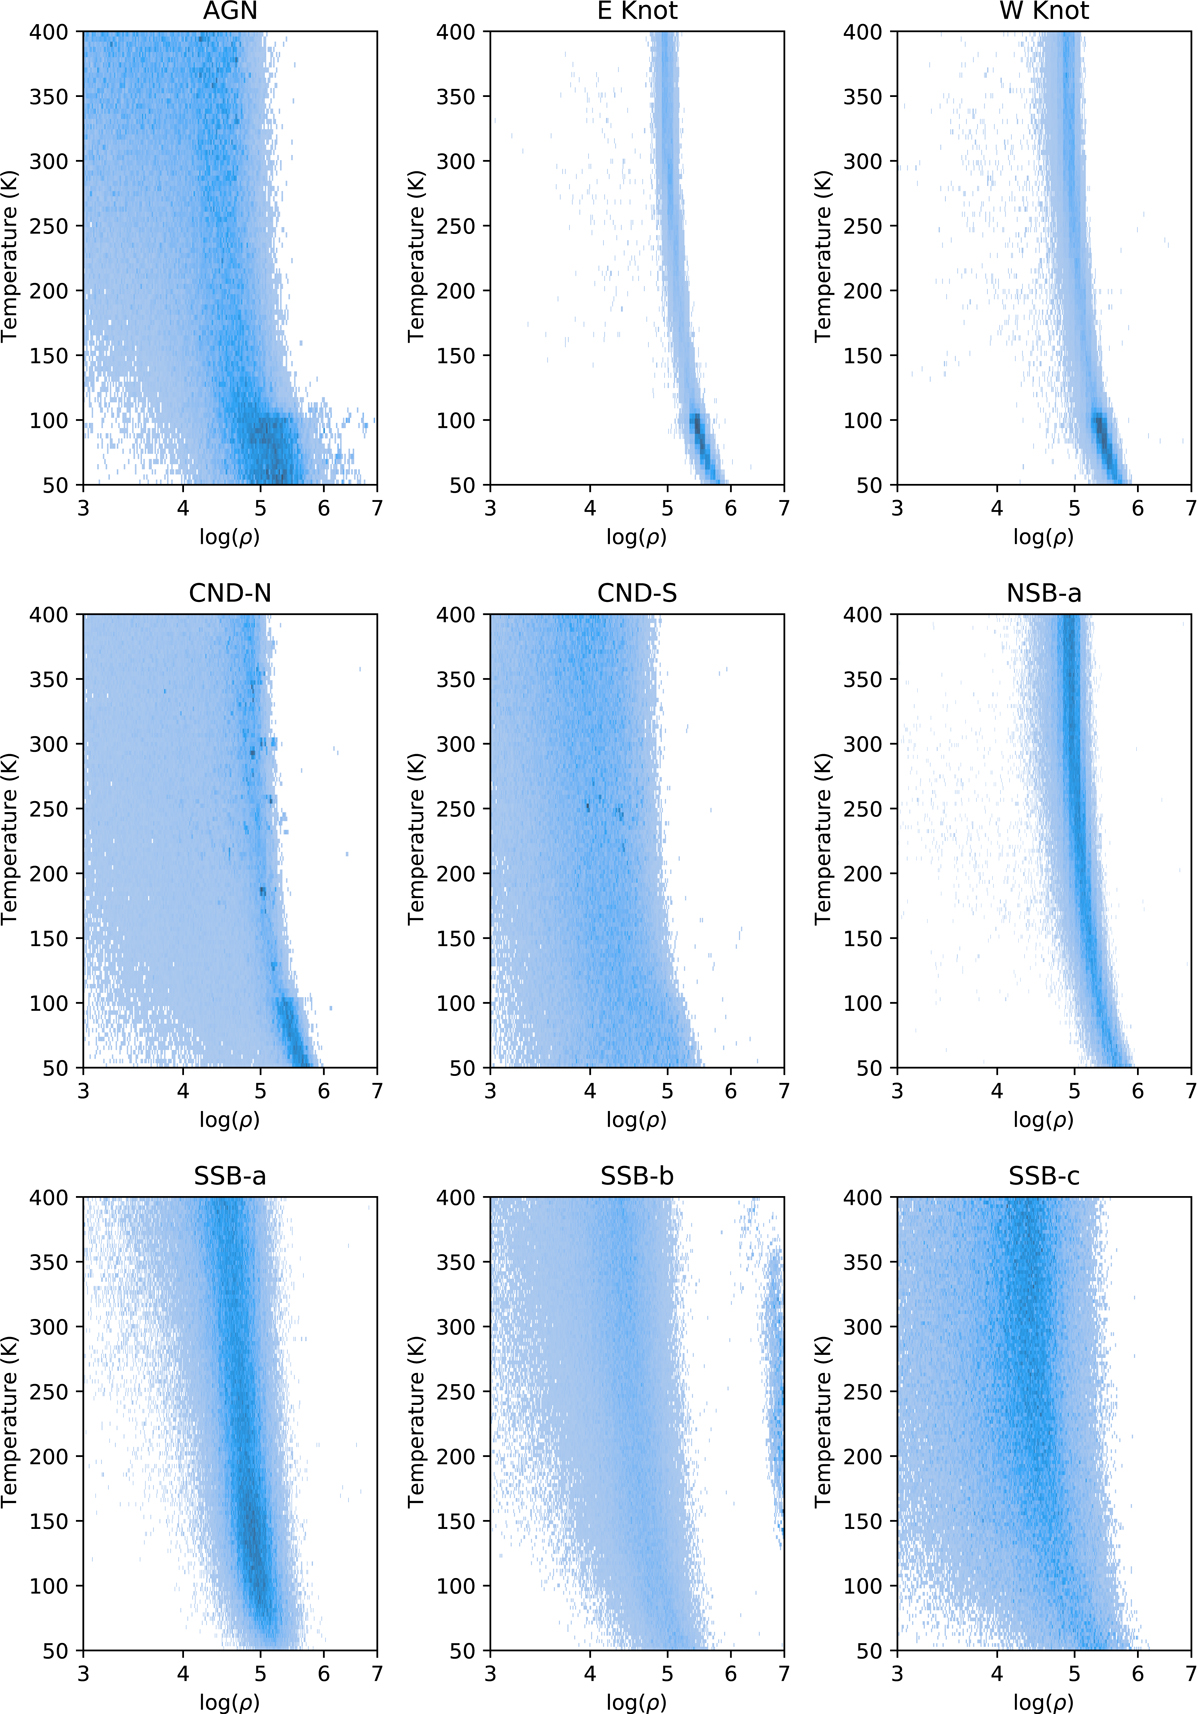
Fig. A.1.
Download original image
Resulting joint posterior distributions for temperature and density as produced for the high resolution (∼40 pc scale data) for the nine regions that have enough ratios to fit. The temperasture and density values shown in Table 6 are from distributions visualised in this plot. It must be noted that the median values of these distributions, as shown in Table 6, do not always correspond to the most densely populated areas of the corresponding plot. This is due to the extent of the posterior distribution in the temperature plane.
Current usage metrics show cumulative count of Article Views (full-text article views including HTML views, PDF and ePub downloads, according to the available data) and Abstracts Views on Vision4Press platform.
Data correspond to usage on the plateform after 2015. The current usage metrics is available 48-96 hours after online publication and is updated daily on week days.
Initial download of the metrics may take a while.