Fig. 9.
Download original image
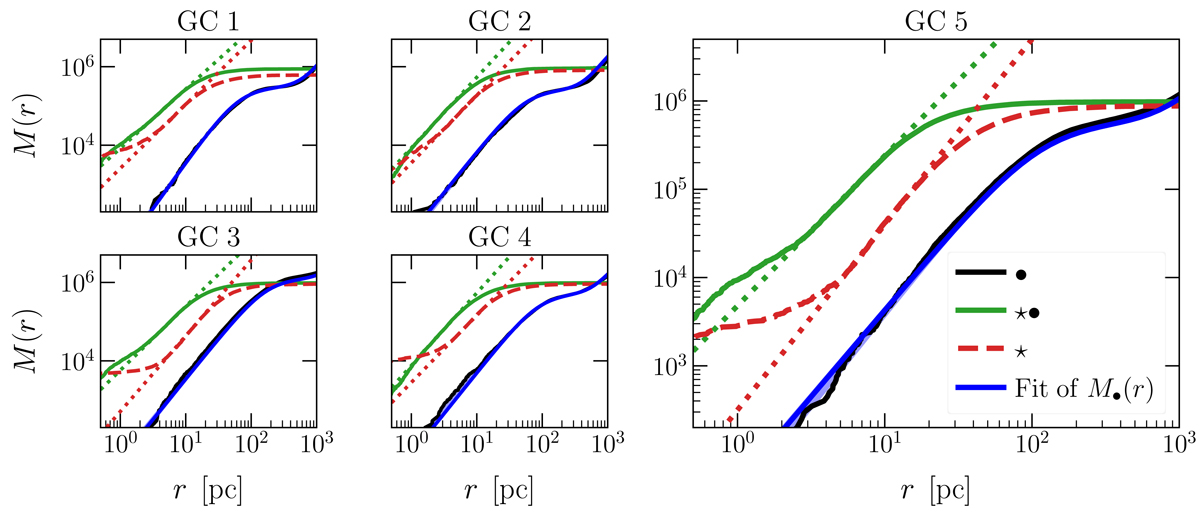
Cumulative mass profiles: We display the cumulative mass profiles at the last snapshot of our simulations, for the dark matter particles (black), their embedded stellar component (green) and the stellar component from the simulations without dark matter (dashed red). The blue line depicts the MCMC fit of a Zhao (1996)αβγ model to the dark matter mini-halo (see Sect. 4.2.2), with a fainter blue region encompassing the [2.5, 97.5] percentiles. The dotted lines represent local slopes of the stellar mass distribution at the respective regions shown in the plot.
Current usage metrics show cumulative count of Article Views (full-text article views including HTML views, PDF and ePub downloads, according to the available data) and Abstracts Views on Vision4Press platform.
Data correspond to usage on the plateform after 2015. The current usage metrics is available 48-96 hours after online publication and is updated daily on week days.
Initial download of the metrics may take a while.