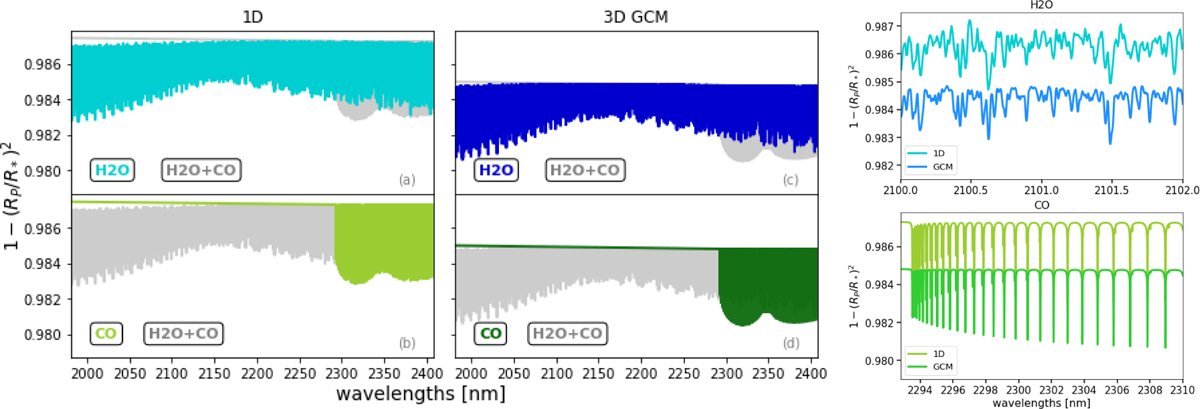
Fig. A.1
Download original image
All models used in this work (see Sec. 3 for details), represented as the flux received from the star during transit relative to the out-of-transit stellar flux as a function of wavelengths (left). From left to right, we show the 1D models [panels (a) and (b)] and GCMs [panels (c) and (d)]. In each plot, the gray line plots the model in which both molecular species were studied in this work, i.e., water and carbon monoxide. Only H2O [panels (a),(c)] and only CO [panels (b),(d)] models are overplotted with blue and green colors, respectively, in the top and bottom panels. Overall, GCMs (darker colors) have a deeper absorption than the 1D models (lighter colors) due to a different starting pressure at the bottom of the atmosphere. A zoom over a smaller wavelength range of only H2O (top panel) and only CO (bottom panel) 1D and 3D models is shown (right).
Current usage metrics show cumulative count of Article Views (full-text article views including HTML views, PDF and ePub downloads, according to the available data) and Abstracts Views on Vision4Press platform.
Data correspond to usage on the plateform after 2015. The current usage metrics is available 48-96 hours after online publication and is updated daily on week days.
Initial download of the metrics may take a while.