Fig. 8.
Download original image
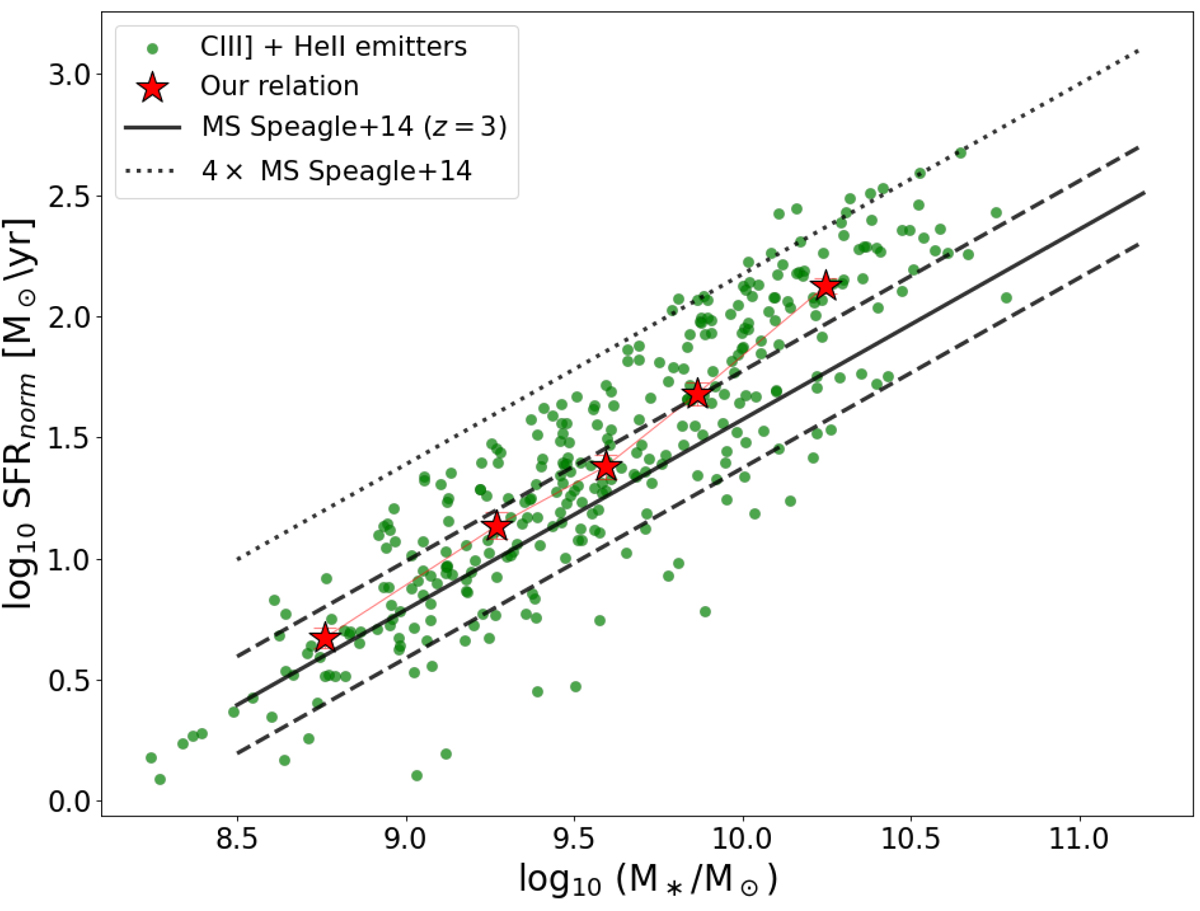
Star-formation rate–stellar mass diagram for the sample of 330 C III] + He II emitters selected for our analysis. The main sequence relation by Speagle et al. (2014) is drawn with a black continuous line, while the dashed parallel lines represent the 1σ dispersion and the dotted line the starburst limit (4× above the main sequence). Our best-fit M⋆–SFR relation is represented with large red stars. On the y axis, we consider the SFR normalised to z = 3 assuming the evolving trend with redshift as (1 + z)2.8 from Sargent et al. (2012).
Current usage metrics show cumulative count of Article Views (full-text article views including HTML views, PDF and ePub downloads, according to the available data) and Abstracts Views on Vision4Press platform.
Data correspond to usage on the plateform after 2015. The current usage metrics is available 48-96 hours after online publication and is updated daily on week days.
Initial download of the metrics may take a while.