Fig. 6.
Download original image
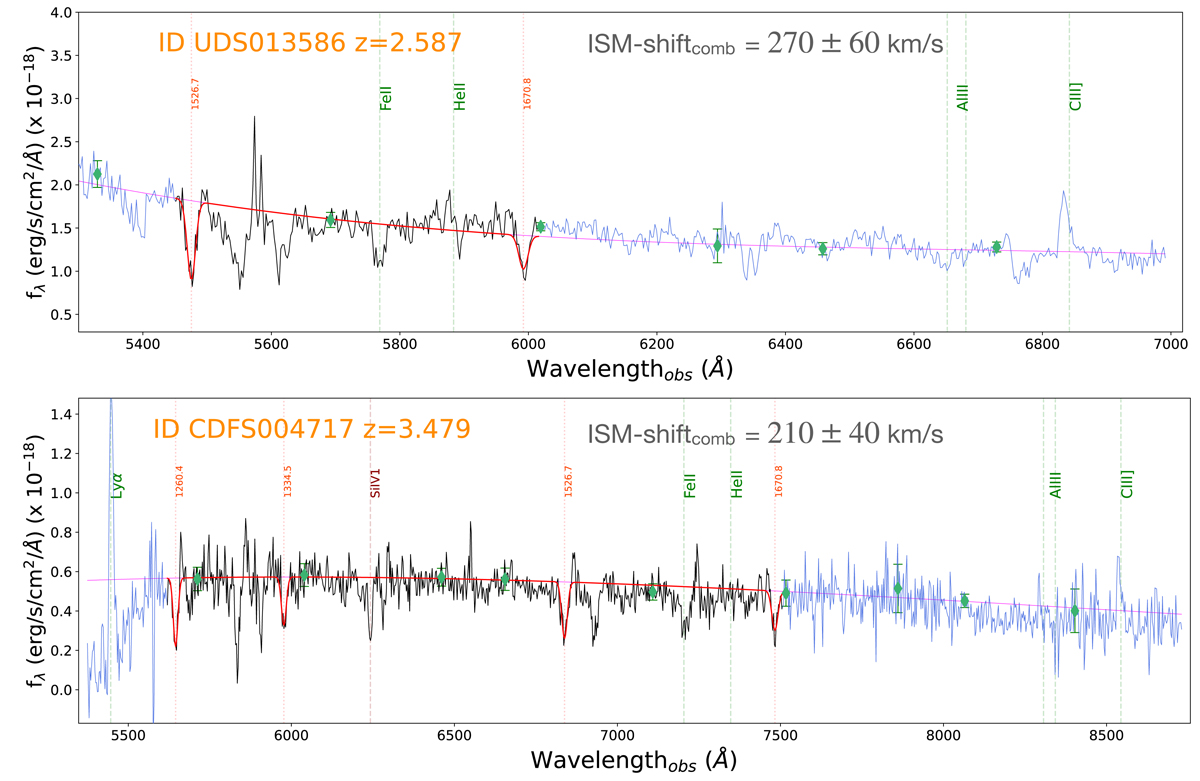
Figure shows the spectrum of two galaxies at redshifts 2.587 and 3.479 in the UDS and CDFS field (top and bottom panels, respectively) with the combined fit of low-ionisation absorption lines (red), and for which we detect significant inflow signatures, with positive ISM velocity shifts as indicated in each panel (i.e. the centroids of ISM absorption lines are redshifted compared to the C III] centroid used for the systemic redshift).
Current usage metrics show cumulative count of Article Views (full-text article views including HTML views, PDF and ePub downloads, according to the available data) and Abstracts Views on Vision4Press platform.
Data correspond to usage on the plateform after 2015. The current usage metrics is available 48-96 hours after online publication and is updated daily on week days.
Initial download of the metrics may take a while.