Open Access
Fig. 4.
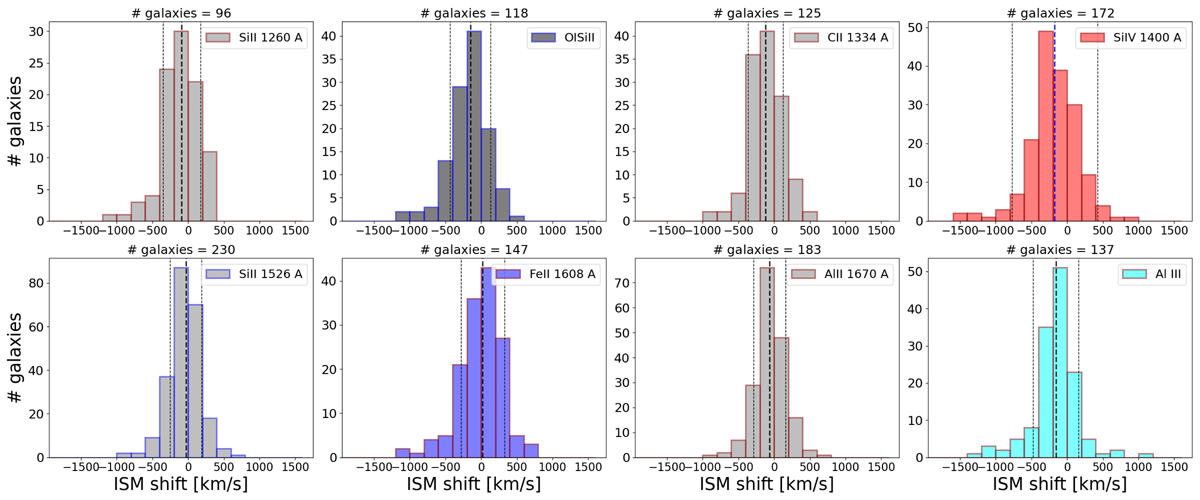
Download original image
Distribution of ISM shift for the same lines shown in Fig. 3. Symbols and colours are the same as in the previous plot. The two dotted lines in addition to the dashed line of the median represent the standard deviation of vIS values. The number of galaxies contributing to each histogram is written in the top of each panel.
Current usage metrics show cumulative count of Article Views (full-text article views including HTML views, PDF and ePub downloads, according to the available data) and Abstracts Views on Vision4Press platform.
Data correspond to usage on the plateform after 2015. The current usage metrics is available 48-96 hours after online publication and is updated daily on week days.
Initial download of the metrics may take a while.