Fig. 2.
Download original image
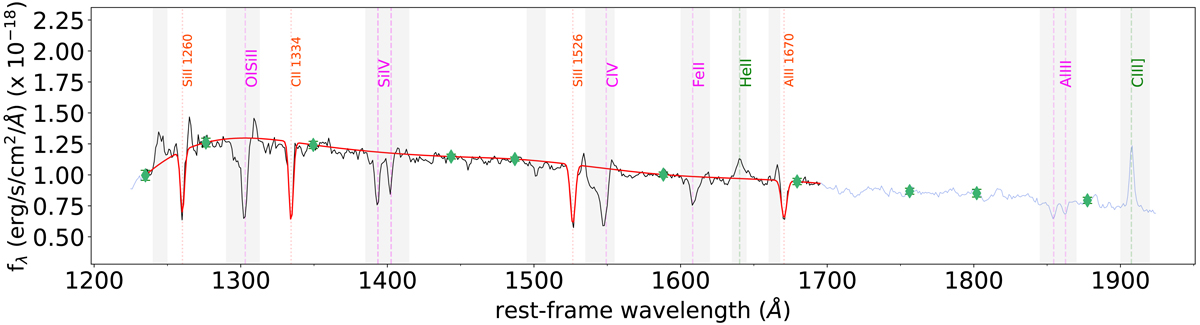
Stack of all star-forming galaxies selected for our analysis (AGNs excluded). The green diamonds represent the pseudocontinuum points used for fitting the cubic spline to the stellar continuum. The red continuous line highlights the combined fit to the Si IIλ1260, Si IIλ1526, C IIλ1334, and Al IIλ1670 absorption lines, while the grey shaded regions have been masked in the fit. The vertical lines highlight the features used in the combined fit (in red), the absorption lines excluded from the combined fit but measured separately (in pink), and the emission lines used for the systemic redshift estimation (in green).
Current usage metrics show cumulative count of Article Views (full-text article views including HTML views, PDF and ePub downloads, according to the available data) and Abstracts Views on Vision4Press platform.
Data correspond to usage on the plateform after 2015. The current usage metrics is available 48-96 hours after online publication and is updated daily on week days.
Initial download of the metrics may take a while.