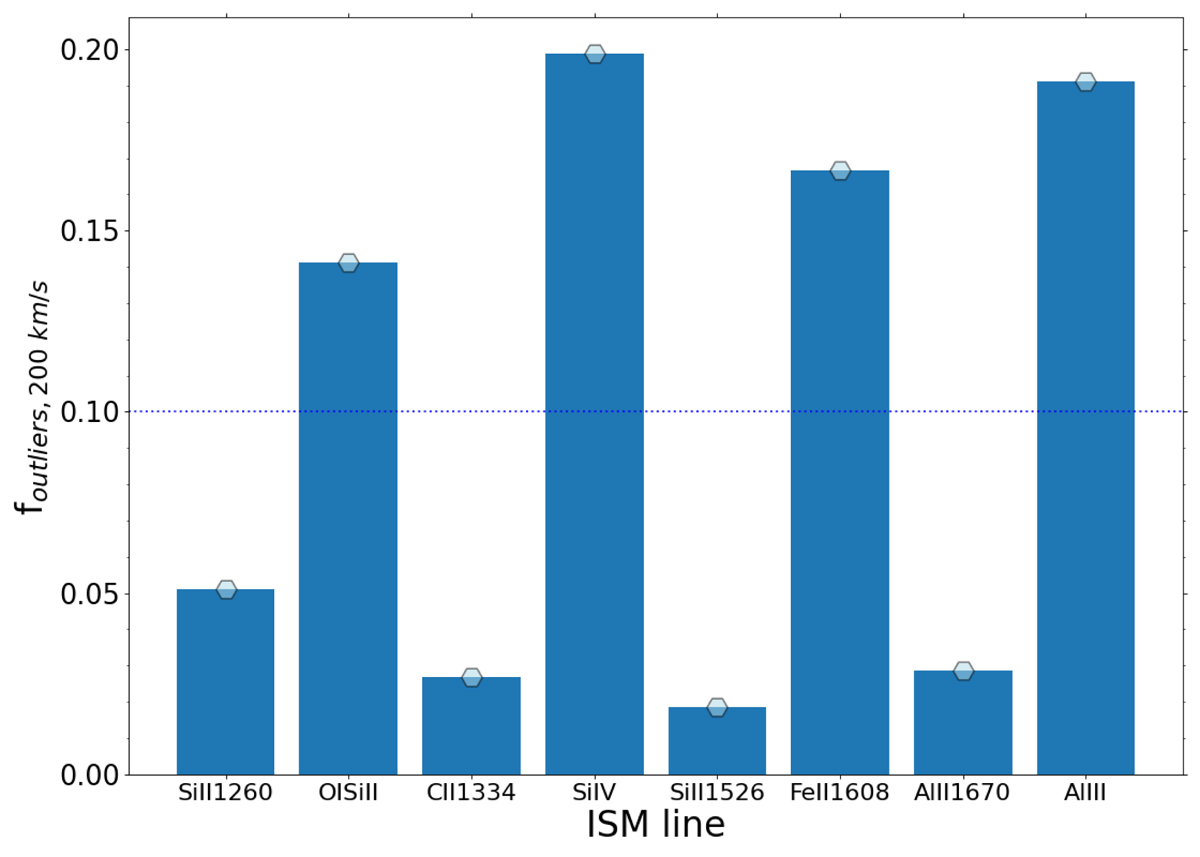
Fig. A.3.
Download original image
Fraction of galaxies for which the redshift measured from the single line fitting differs from the value obtained from a combined fit (including all the ISM lines detected in the spectrum) by more than 200 km/s, for each ISM line analysed in this paper. The horizontal line represents the fraction (10%) above which we have a significant number of outliers and the corresponding lines are not used in the combined fit.
Current usage metrics show cumulative count of Article Views (full-text article views including HTML views, PDF and ePub downloads, according to the available data) and Abstracts Views on Vision4Press platform.
Data correspond to usage on the plateform after 2015. The current usage metrics is available 48-96 hours after online publication and is updated daily on week days.
Initial download of the metrics may take a while.