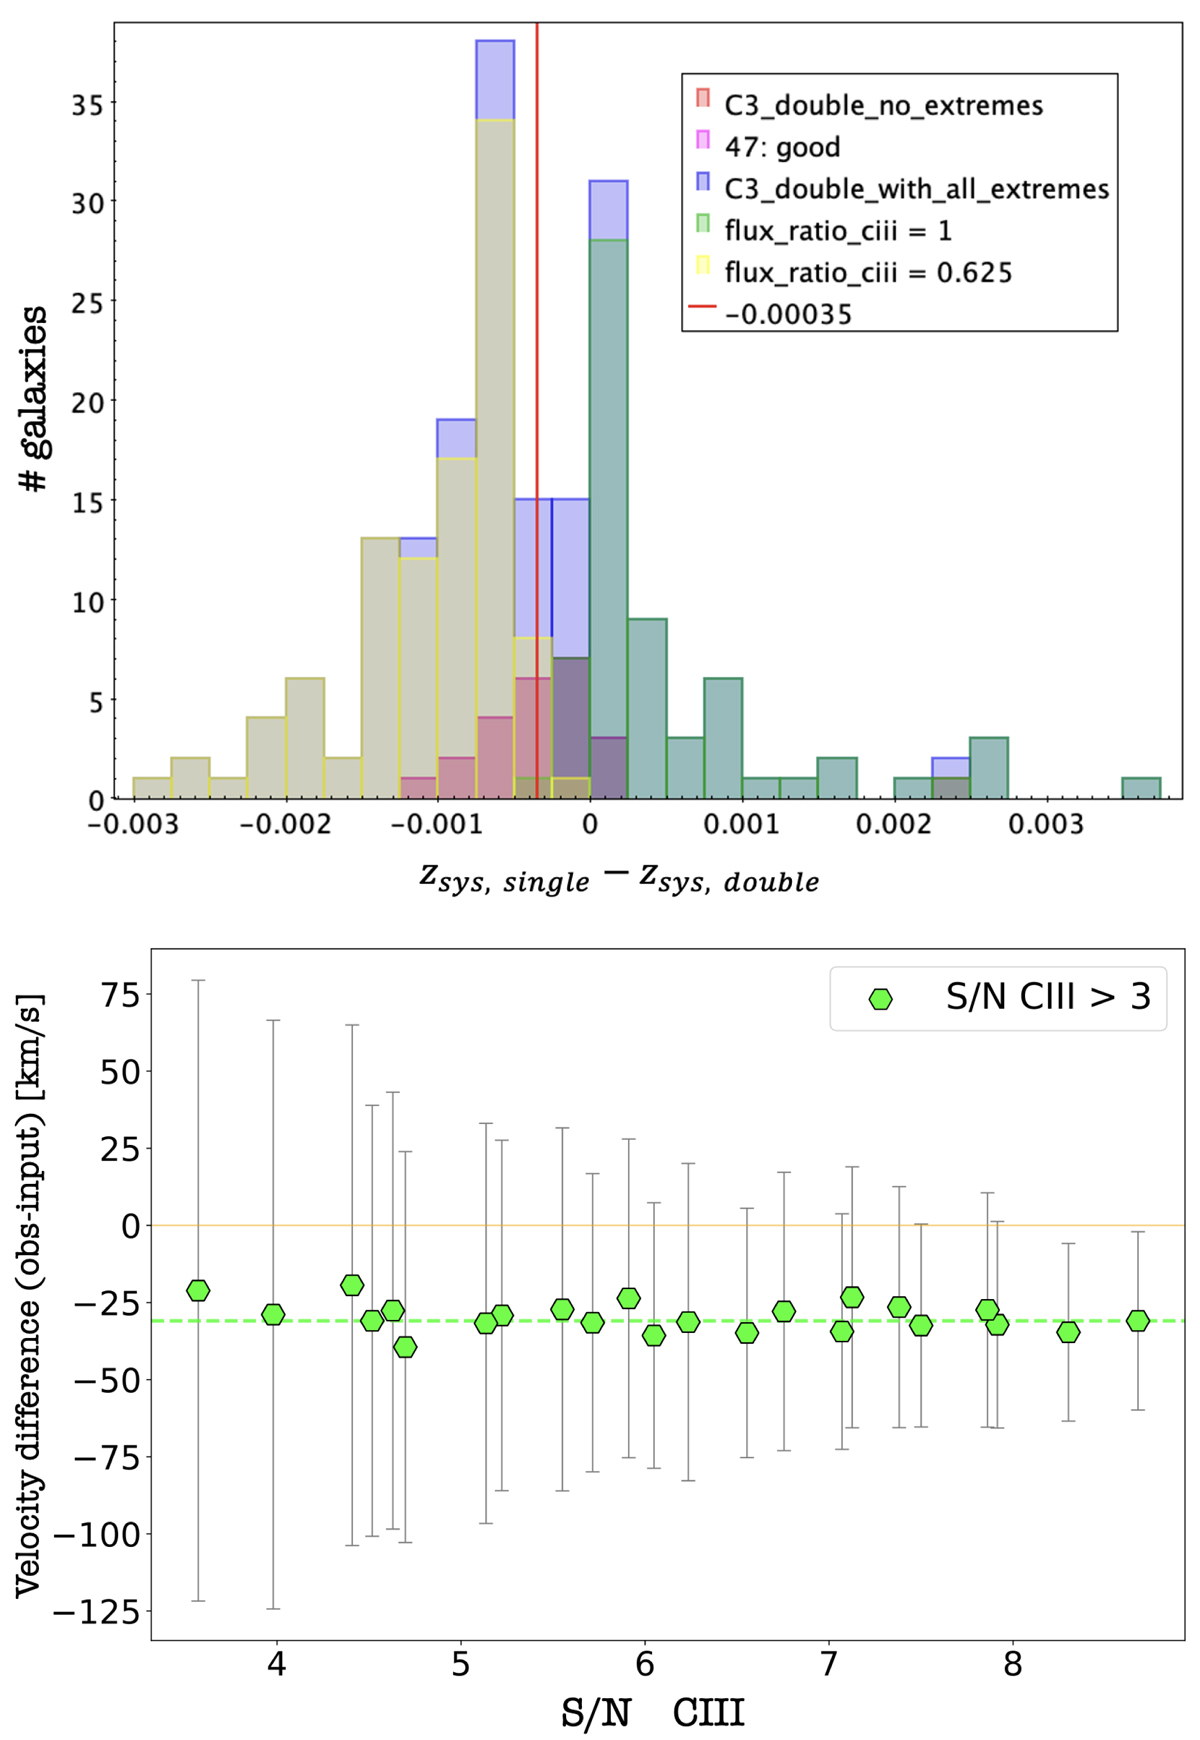
Fig. A.1.
Download original image
Top panel: Histogram distribution of the difference between the systemic redshift estimated from C III] performing a single-Gaussian fit (zsys, single) or a double-component fit (zsys, double). The blue histogram is the sum of all galaxies with C III] detected at S/N ≥3. The yellow and green histograms represent the subsets where the best-fit flux ratio between the two components of the double-Gaussian fit reaches one of the two extremes (respectively 1 and 0.625). The red histogram, from which we derive the correction of 26.25 km/s for the systemic redshift estimated through a single-Gaussian fit, includes galaxies with a best-fit ratio within the allowed range. Bottom panel: Velocity difference between the systemic redshift estimated from a single-Gaussian and a double-Gaussian fit of the C IIIλλ1907-1909 doublet, from Monte Carlo simulations, as a function of the S/N of the C III] line. The horizontal green dashed line represents the median difference for the simulated dataset.
Current usage metrics show cumulative count of Article Views (full-text article views including HTML views, PDF and ePub downloads, according to the available data) and Abstracts Views on Vision4Press platform.
Data correspond to usage on the plateform after 2015. The current usage metrics is available 48-96 hours after online publication and is updated daily on week days.
Initial download of the metrics may take a while.