Fig. 13.
Download original image
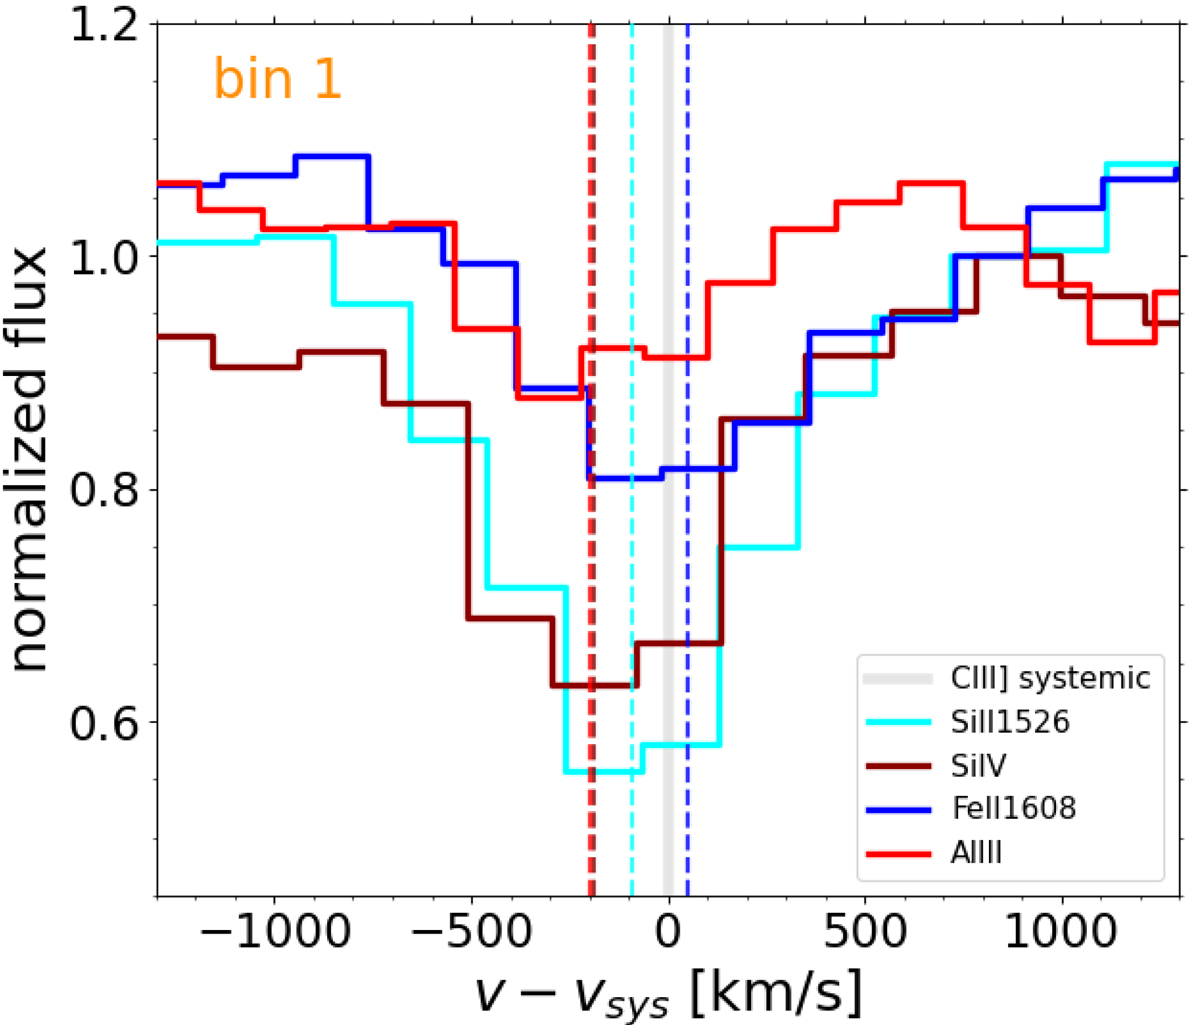
Comparison of the line profiles in the spectral stack including all star-forming galaxies selected in this work (AGNs excluded). The central wavelengths resulting from a Gaussian fit are highlighted in cyan, blue, red, and dark red for the Si IIλ1526 line (representative of low-ionisation lines), Fe IIλ1608, Al IIIλλ1854-1862, and Si IVλλ1393-1402, respectively.
Current usage metrics show cumulative count of Article Views (full-text article views including HTML views, PDF and ePub downloads, according to the available data) and Abstracts Views on Vision4Press platform.
Data correspond to usage on the plateform after 2015. The current usage metrics is available 48-96 hours after online publication and is updated daily on week days.
Initial download of the metrics may take a while.