Fig. 12.
Download original image
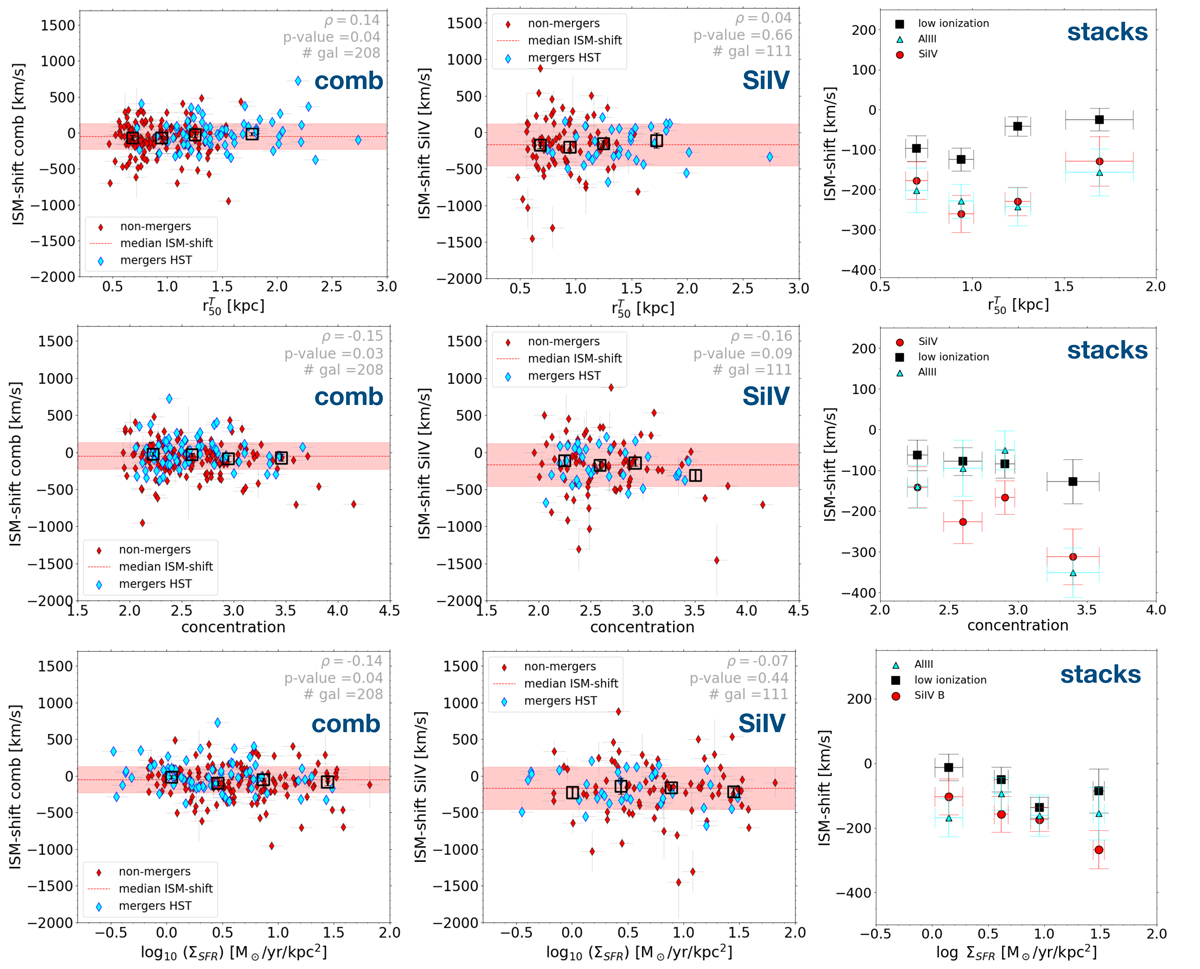
Diagrams comparing vIS,comb, vIS,Si IV and vIS,Al III to the equivalent radius ![]() , the concentration parameter CT, and the SFR surface density ΣSFR, respectively, from top to bottom row. The derivation of the plots in each single row and the symbols are the same as explained in Fig. 11. The scatter plots presented in this figure are limited to galaxies with an available HST F814W image.
, the concentration parameter CT, and the SFR surface density ΣSFR, respectively, from top to bottom row. The derivation of the plots in each single row and the symbols are the same as explained in Fig. 11. The scatter plots presented in this figure are limited to galaxies with an available HST F814W image.
Current usage metrics show cumulative count of Article Views (full-text article views including HTML views, PDF and ePub downloads, according to the available data) and Abstracts Views on Vision4Press platform.
Data correspond to usage on the plateform after 2015. The current usage metrics is available 48-96 hours after online publication and is updated daily on week days.
Initial download of the metrics may take a while.