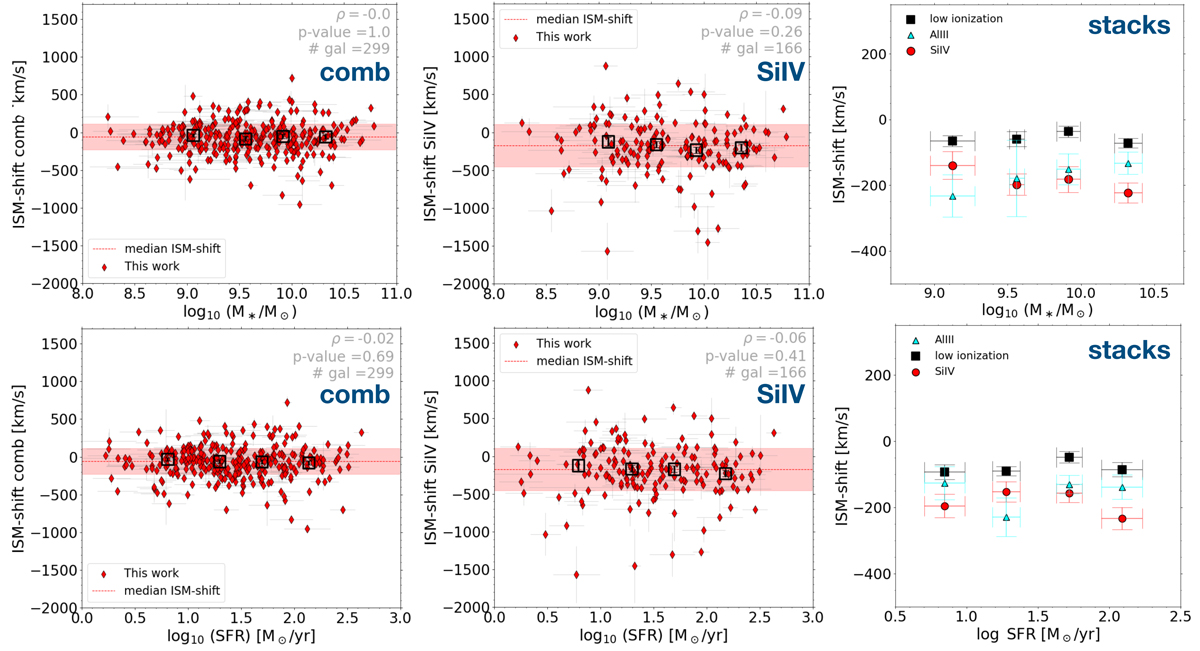
Fig. 11.
Download original image
Upper panel: correlation of vIS,comb, vIS,Si IV and vIS,Al III with the stellar mass M⋆ for VANDELS star-forming galaxies selected in this work. The first two panels in each row show the relation for individual galaxies (red diamonds), while the black empty squares are the median vIS in bins of increasing M⋆. The red horizontal continuous line shows the median vIS for the entire sample shown in each plot, while the red shaded regions highlight the standard deviation of all the ISM shift values. The last panel of the row shows the velocity shifts calculated directly from the spectral stacks in four bins of stellar mass. Lower panel: same as above but as a function of the SFR.
Current usage metrics show cumulative count of Article Views (full-text article views including HTML views, PDF and ePub downloads, according to the available data) and Abstracts Views on Vision4Press platform.
Data correspond to usage on the plateform after 2015. The current usage metrics is available 48-96 hours after online publication and is updated daily on week days.
Initial download of the metrics may take a while.