Open Access
Fig. 1.
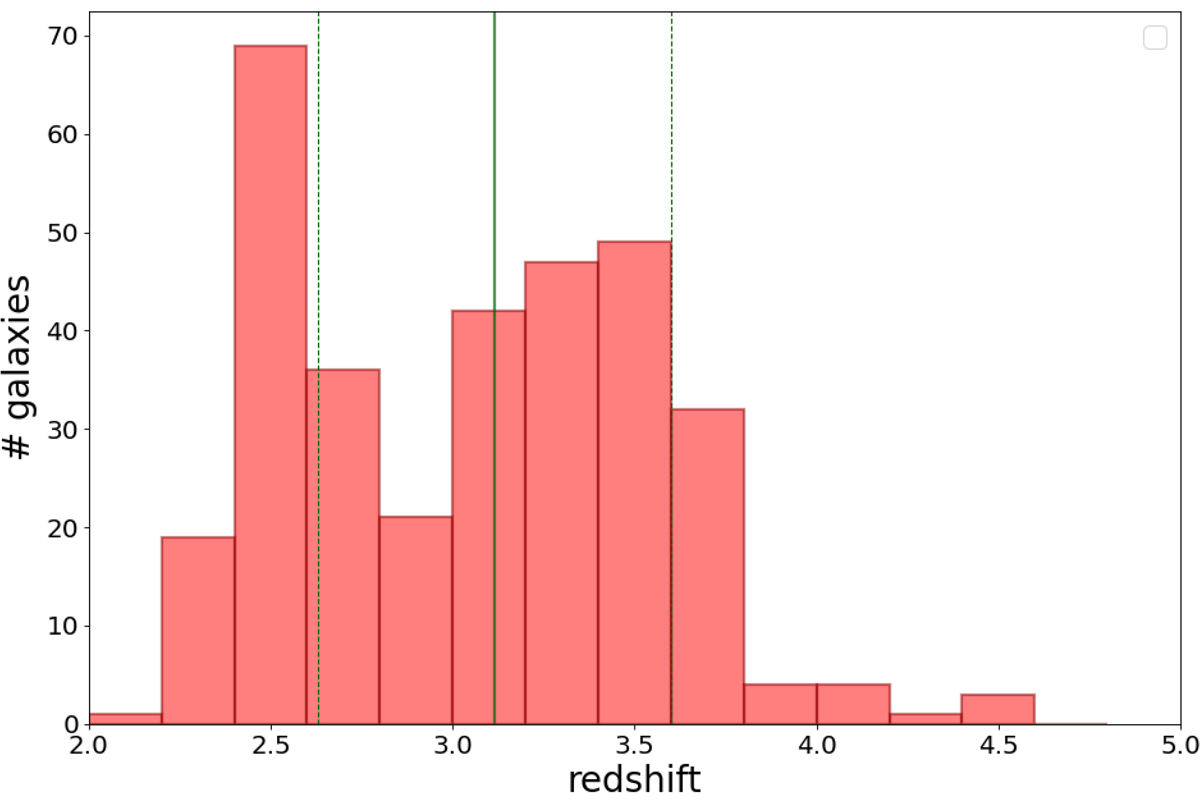
Download original image
Systemic redshift distribution of galaxies with C III] or He II emission at S/N ≥ 3, selected in this work as described in the text. The green vertical lines represent the median redshift of the sample (continuous line) and the standard deviation of the distribution (dotted lines).
Current usage metrics show cumulative count of Article Views (full-text article views including HTML views, PDF and ePub downloads, according to the available data) and Abstracts Views on Vision4Press platform.
Data correspond to usage on the plateform after 2015. The current usage metrics is available 48-96 hours after online publication and is updated daily on week days.
Initial download of the metrics may take a while.