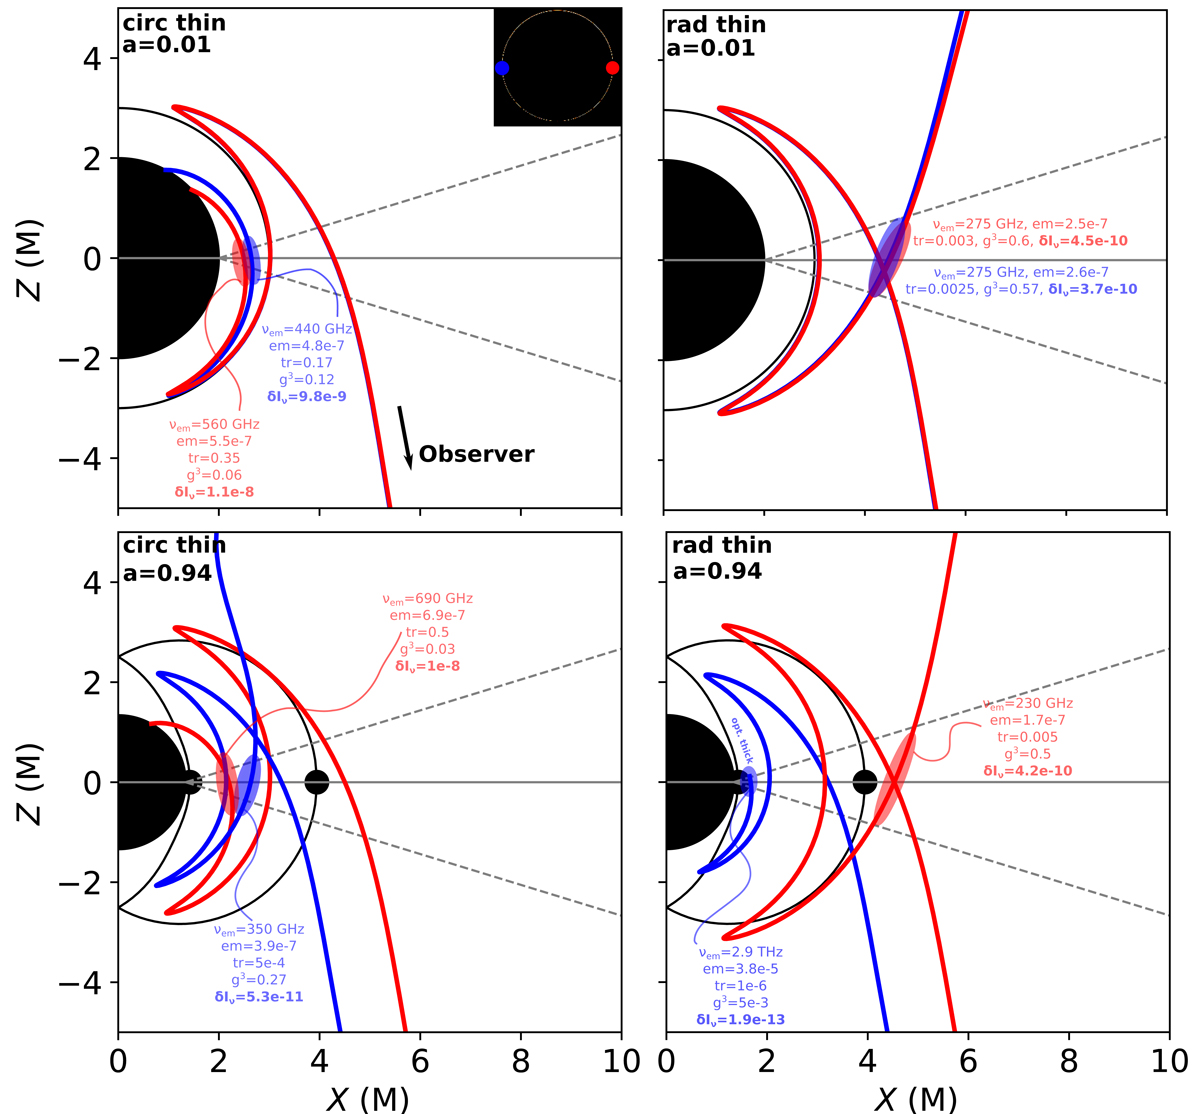
Fig. 5.
Download original image
Origin of n = 2 emission. We show geodesics corresponding to the maximum intensity of the n = 2 ring of each model along a horizontal cut, on the left (blue) and right (red) sides of the image (see inset of the upper-left panel). The accretion flow and spin parameters are specified in the upper-left corner of each panel. The blue and red ellipses encircle the region emitting most of the n = 2 photons loaded onto each geodesic. The blue geodesic is abruptly cut in the lower-right panel because the medium becomes optically too thick (defined in the code as a transmission smaller than 10−6). For each ellipse, the local values of the emitted frequency (νem), self-absorbed emission (em, in cgs units), transmission (tr), and redshift factor (g3) are provided, as well as the resulting increment of specific intensity δIν (see Eq. (13) for the definition of these quantities).
Current usage metrics show cumulative count of Article Views (full-text article views including HTML views, PDF and ePub downloads, according to the available data) and Abstracts Views on Vision4Press platform.
Data correspond to usage on the plateform after 2015. The current usage metrics is available 48-96 hours after online publication and is updated daily on week days.
Initial download of the metrics may take a while.