Fig. 3.
Download original image
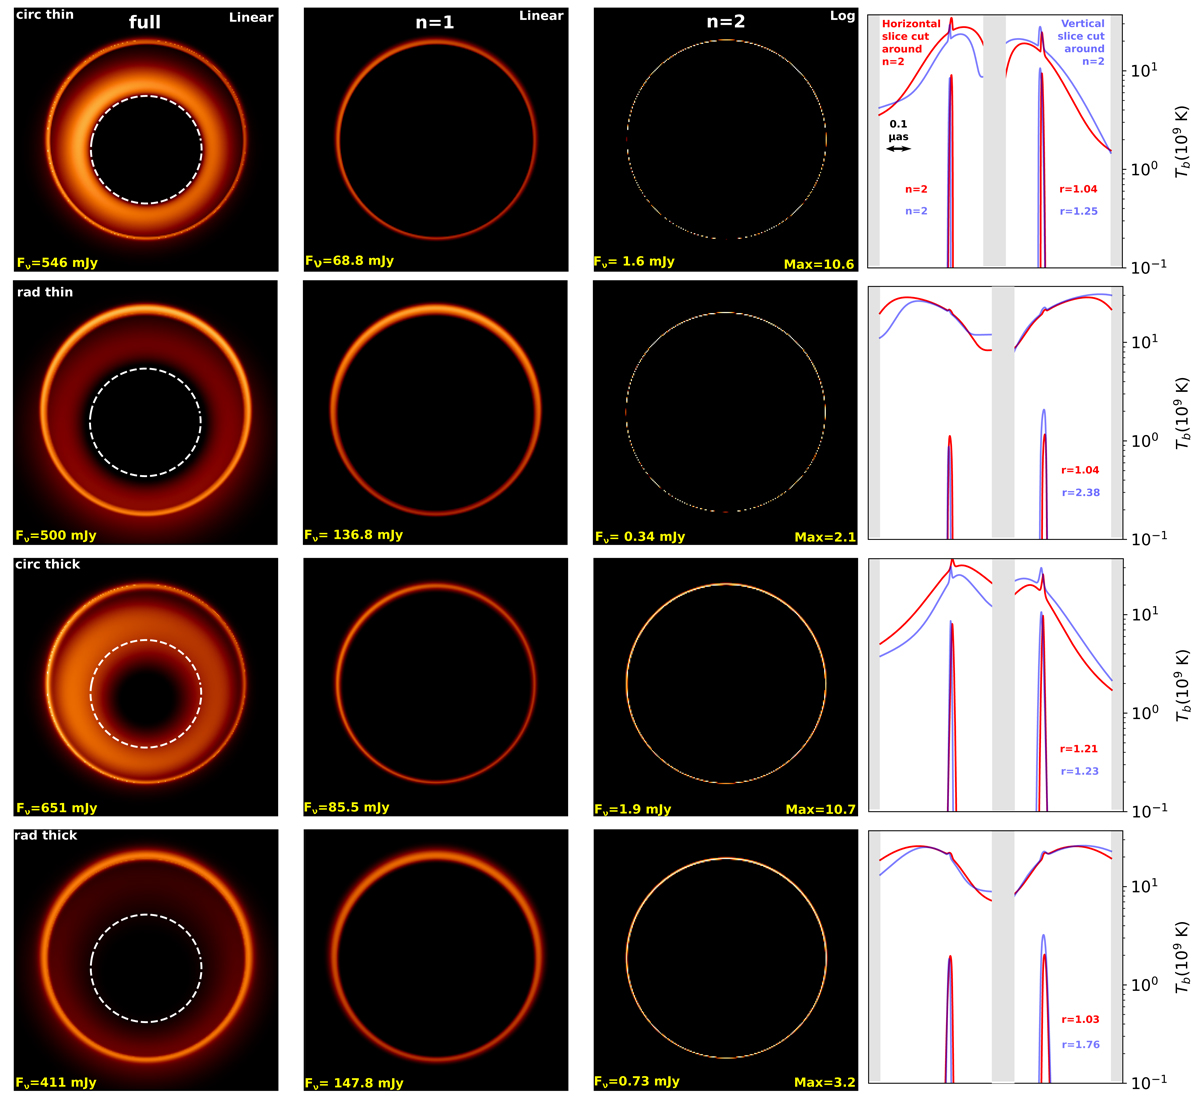
Images and photon rings at 230 GHz. Three leftmost columns: inner 50 μas of the low-spin (a = 0.01) brightness temperature maps. The two left columns share the same linear color scale, which goes up to a brightness temperature of 3.7 × 10¹⁰ K. The third column is in logarithmic scale, with the overall scale varying across panels to enable better visualization. The total specific flux of each image, as well as the maximum brightness temperature of each n = 2 image (in units of 109 K), are indicated in yellow font. The white dashed curve in the left column shows the primary image of the equatorial event horizon. Rightmost column: Horizontal (red) and vertical (blue) cuts of the full and n = 2 brightness temperature profiles, centered around the n = 2 peaks regions. The temperature ratios r between the two n = 2 peaks are provided.
Current usage metrics show cumulative count of Article Views (full-text article views including HTML views, PDF and ePub downloads, according to the available data) and Abstracts Views on Vision4Press platform.
Data correspond to usage on the plateform after 2015. The current usage metrics is available 48-96 hours after online publication and is updated daily on week days.
Initial download of the metrics may take a while.