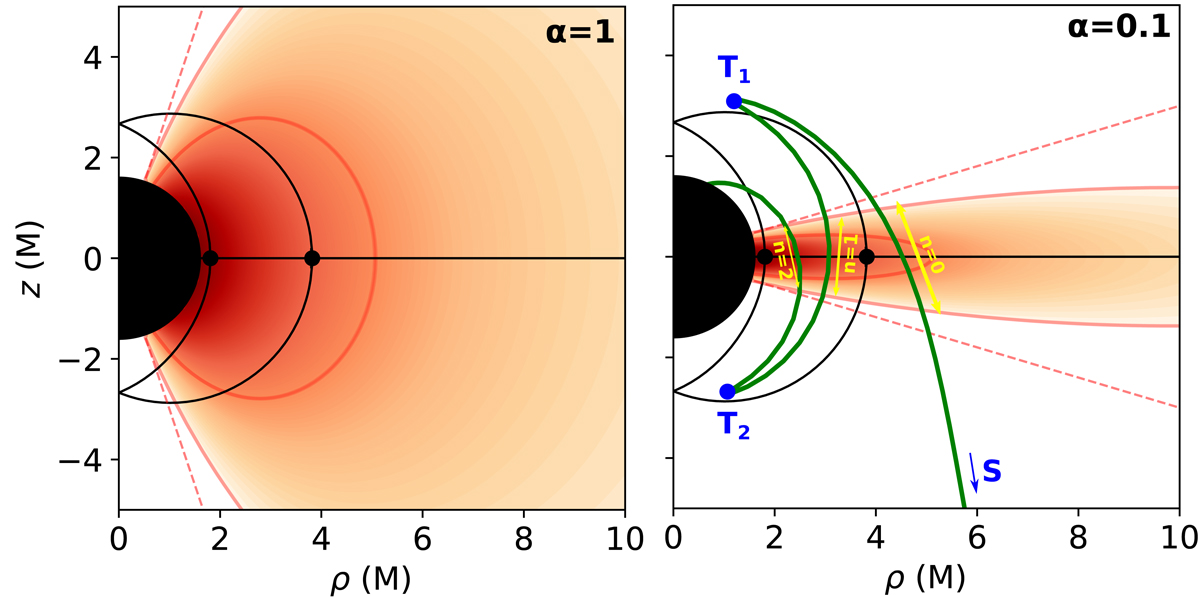
Fig. 2.
Download original image
Density profiles of the “thick” (α = 1, left) and “thin” (α = 0.1, right) disk models we consider. The plots display the poloidal (ρ, z) plane, with all azimuthal angles ϕ projected to one single point in the plane. The filled black area is the black hole event horizon. The solid black lines delineate the region in which bound photon orbits exist (the “photon shell”), with the circular-equatorial orbits (prograde and retrograde) indicated by black dots. The red color scale encodes the log-scale profile of the electron number density, with a floor set at 1% of the maximum density (this floor is only applied to this figure for readability; it is not applied in our model). The two solid red contours correspond to a density of 1% and 10% of the maximum. The dashed red lines enclose the points located at a height less than 3sz above the equatorial plane, where sz is the standard deviation of the Gaussian distribution controlling the electron number density above the equator (Eq. (3)). In the right panel, we also show a high-order null geodesic in green, with blue letters marking the distant observer’s screen (S) and the two θ turning points (T1 and T2) along the geodesic. Very sharp changes of direction appear at the θ turning points. These are due to the 2D projection in the (ρ, z) plane of the three spatial dimensions of the null geodesic. The geodesic represented in 3D space would look perfectly smooth. The n = 0 part of the geodesic extends between S and T1, the n = 1 between T1 and T2, and the n = 2 between T2 and the black hole. The yellow arrows highlight the portions of the null geodesic that are responsible for most of the n = 0, n = 1, and n = 2 emission.
Current usage metrics show cumulative count of Article Views (full-text article views including HTML views, PDF and ePub downloads, according to the available data) and Abstracts Views on Vision4Press platform.
Data correspond to usage on the plateform after 2015. The current usage metrics is available 48-96 hours after online publication and is updated daily on week days.
Initial download of the metrics may take a while.