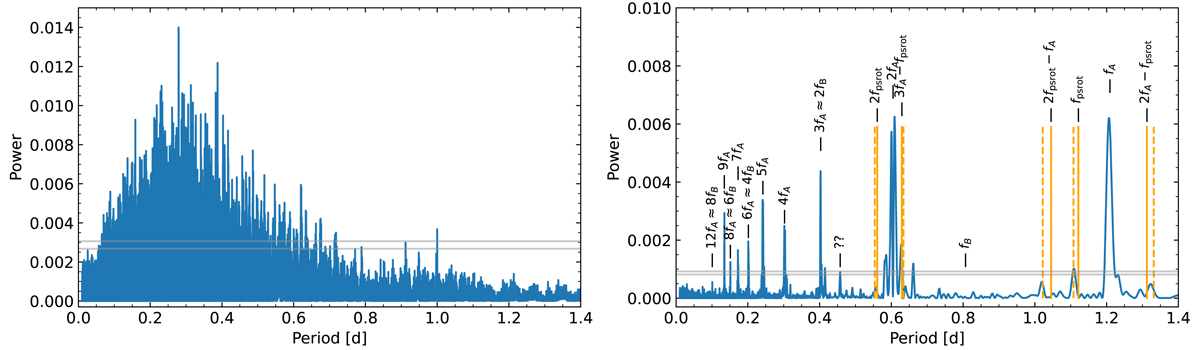
Fig. 6.
Download original image
Periodograms of residuals after fitting the double eclipsing binary model. We show separately ground-based data (left) and TESS short-cadence data (right). The two gray horizontal lines in both panels indicate false alarm probability levels of 0.1 (lower) and 0.01 (upper). Right panel: additionally identification of some of the most prominent modes and their harmonics. Here, the frequency is defined as f = 1/P. The orange vertical lines in the right panel indicate the pseudo-synchronous rotation frequency and its main harmonics that correspond to the eccentricity found in the best double eclipsing binary model (solid) and fpsrot increased by 1% relative to Eq. (9) (dashed).
Current usage metrics show cumulative count of Article Views (full-text article views including HTML views, PDF and ePub downloads, according to the available data) and Abstracts Views on Vision4Press platform.
Data correspond to usage on the plateform after 2015. The current usage metrics is available 48-96 hours after online publication and is updated daily on week days.
Initial download of the metrics may take a while.