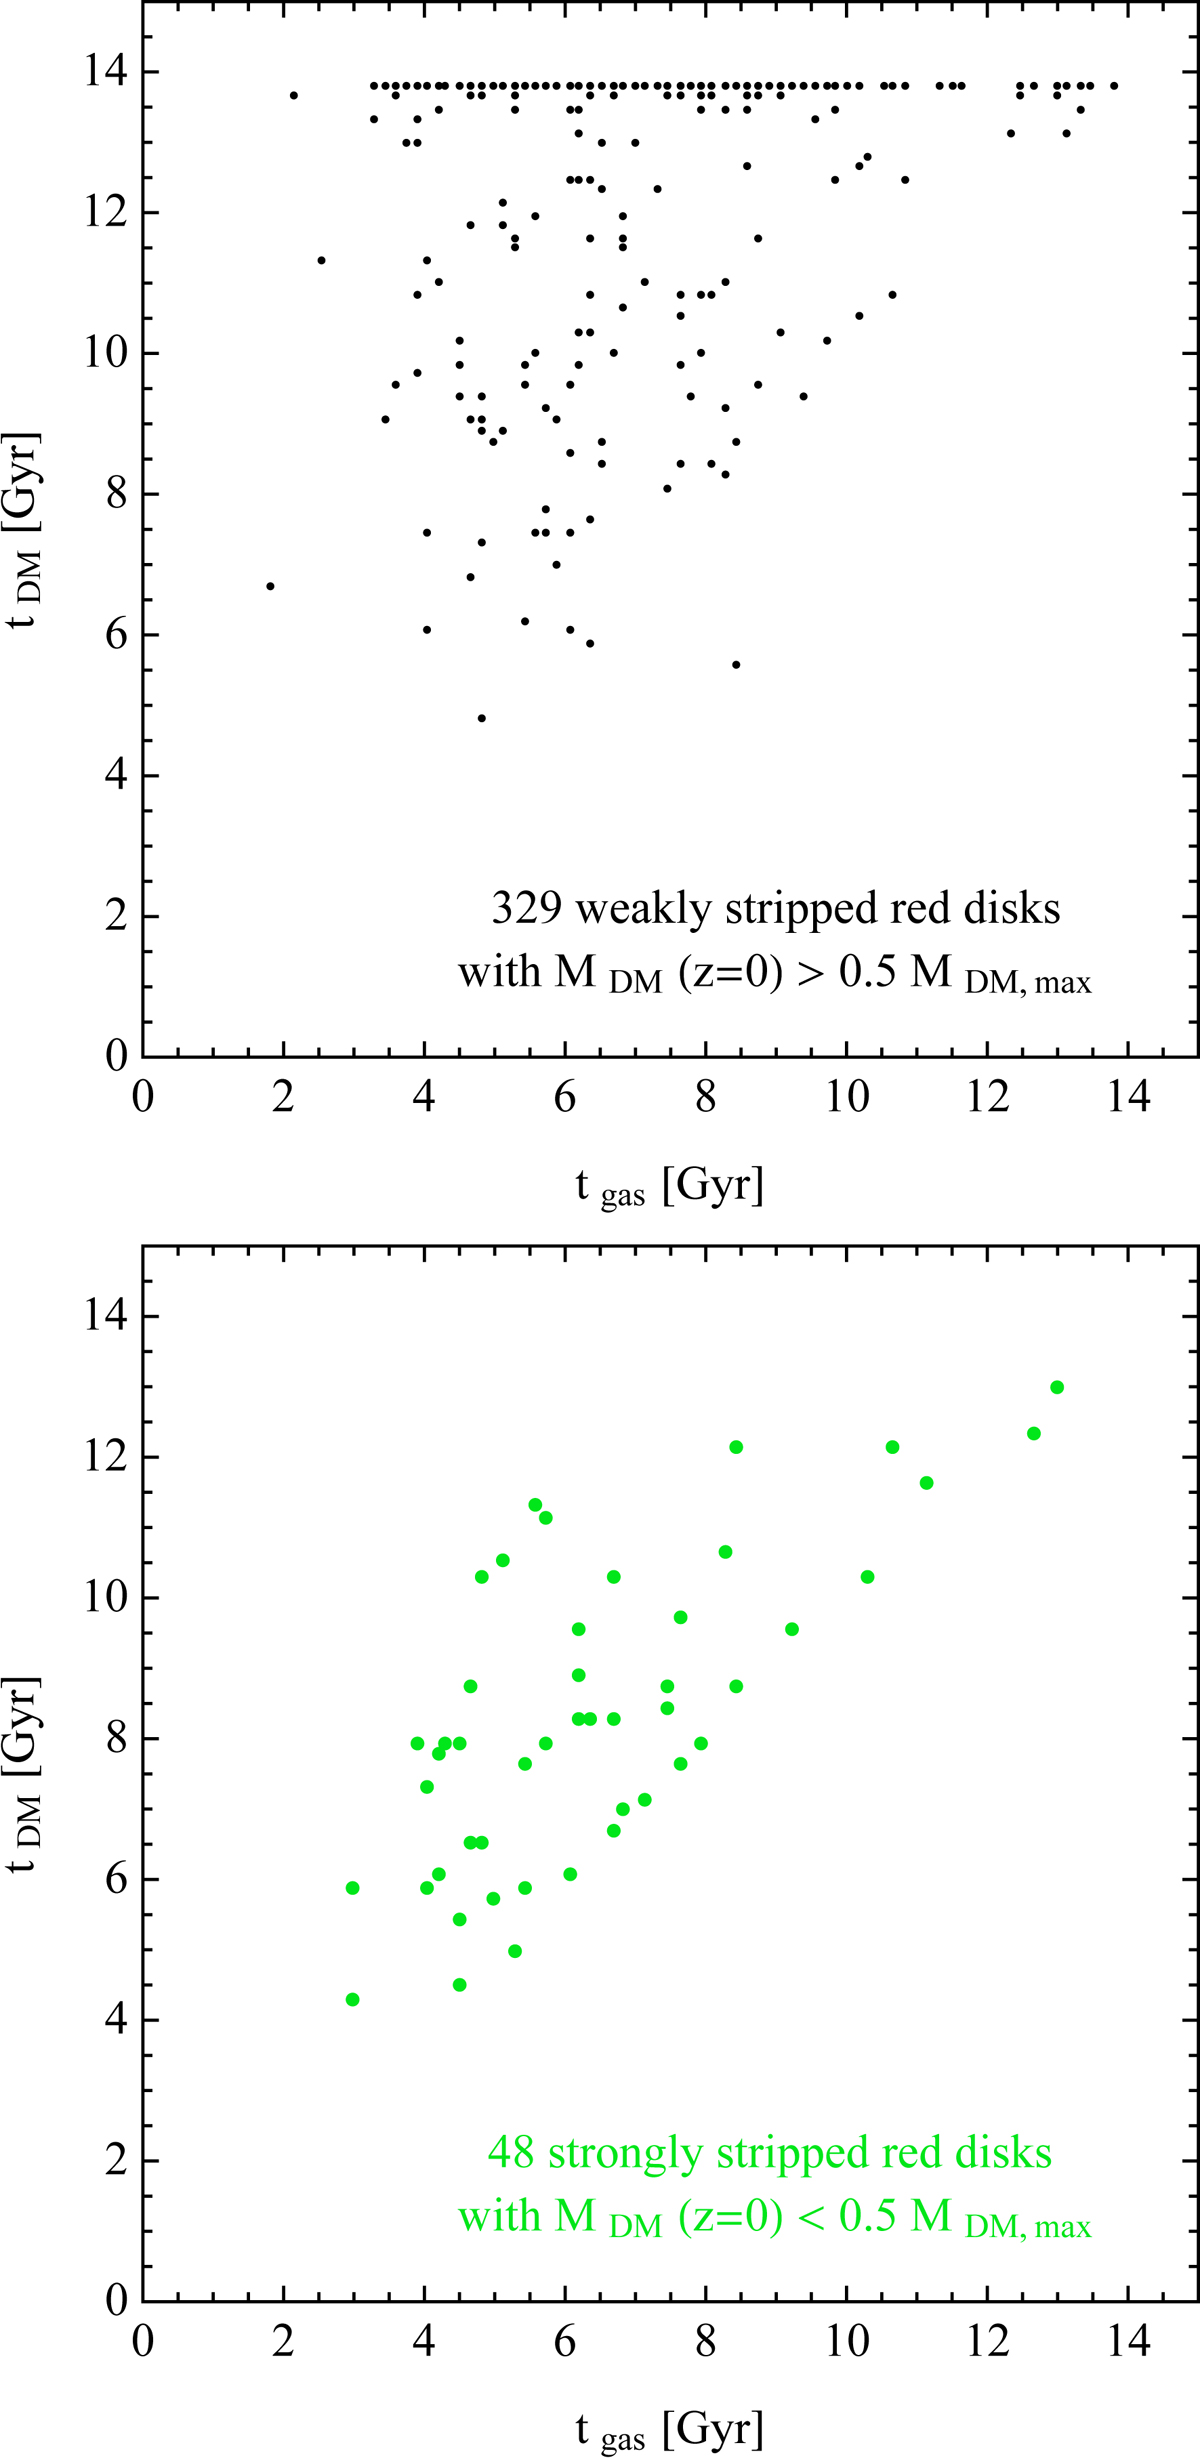
Fig. 5.
Download original image
Relation between characteristic timescales of evolution of gas and dark matter in red disks. Upper panel: time of maximum dark-matter mass versus the time of maximum gas mass for red disks that lost less than half of their maximum dark mass. Lower panel: same for red disks that lost more than half of their maximum dark mass. All 377 red disks were included.
Current usage metrics show cumulative count of Article Views (full-text article views including HTML views, PDF and ePub downloads, according to the available data) and Abstracts Views on Vision4Press platform.
Data correspond to usage on the plateform after 2015. The current usage metrics is available 48-96 hours after online publication and is updated daily on week days.
Initial download of the metrics may take a while.