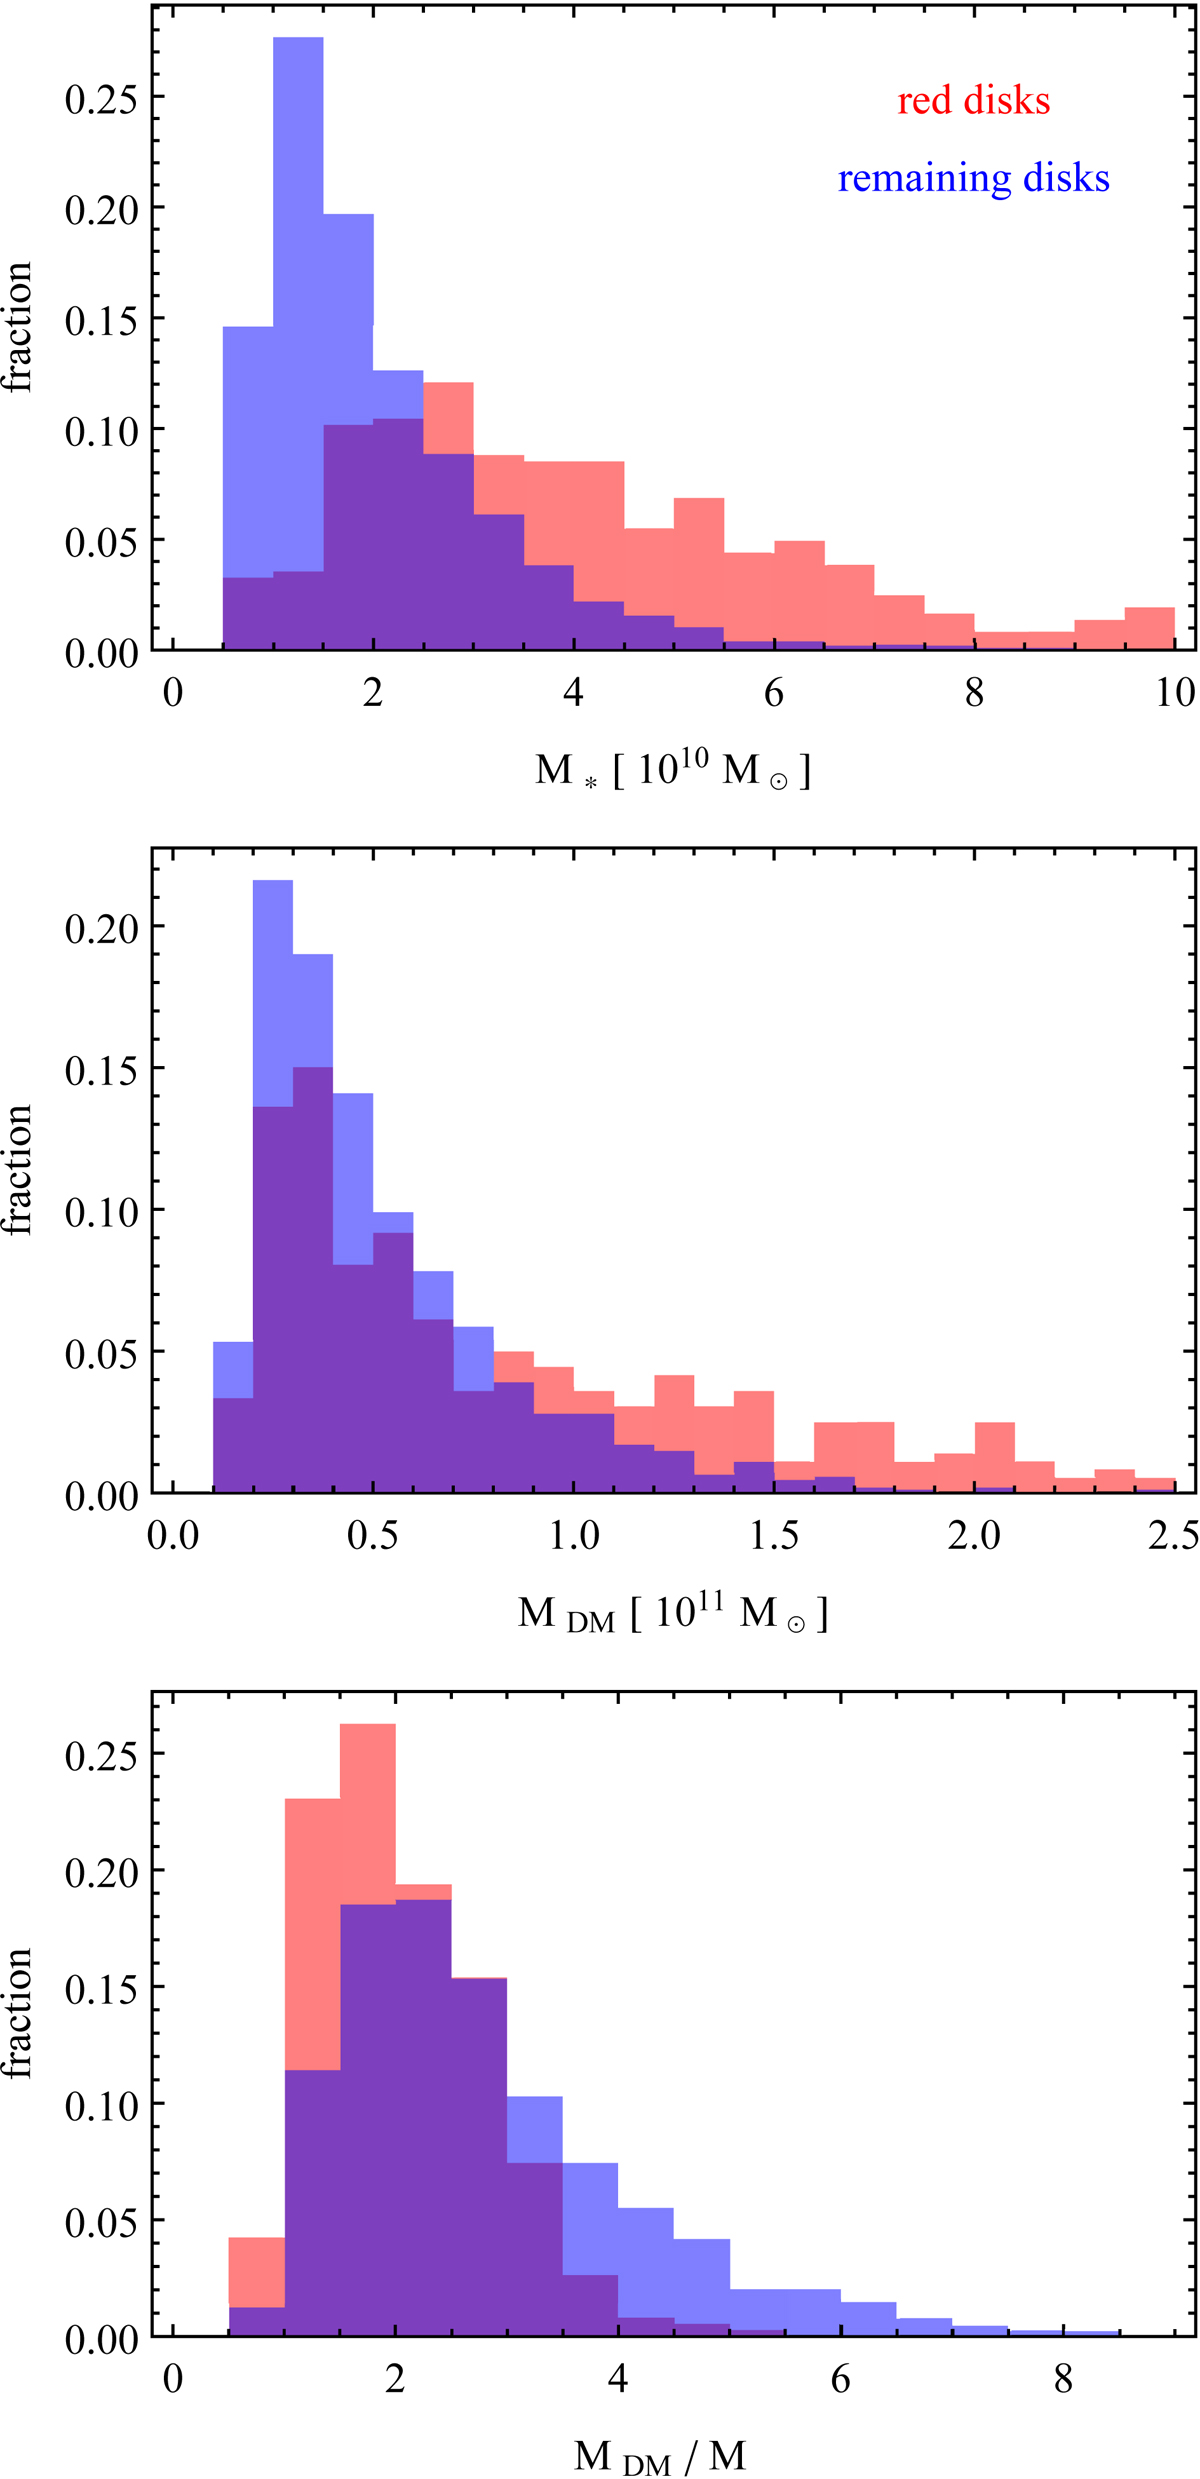
Fig. 10.
Download original image
Distributions of different mass measures of disky galaxies. The three panels, from top to bottom, show the distributions of the stellar mass, the dark mass, and the ratio of the two for red disks with g − r > 0.6 (red) and remaining disks with g − r < 0.6 (blue). Measurements of the properties were done within 2r1/2, and the histograms were normalized to unity.
Current usage metrics show cumulative count of Article Views (full-text article views including HTML views, PDF and ePub downloads, according to the available data) and Abstracts Views on Vision4Press platform.
Data correspond to usage on the plateform after 2015. The current usage metrics is available 48-96 hours after online publication and is updated daily on week days.
Initial download of the metrics may take a while.