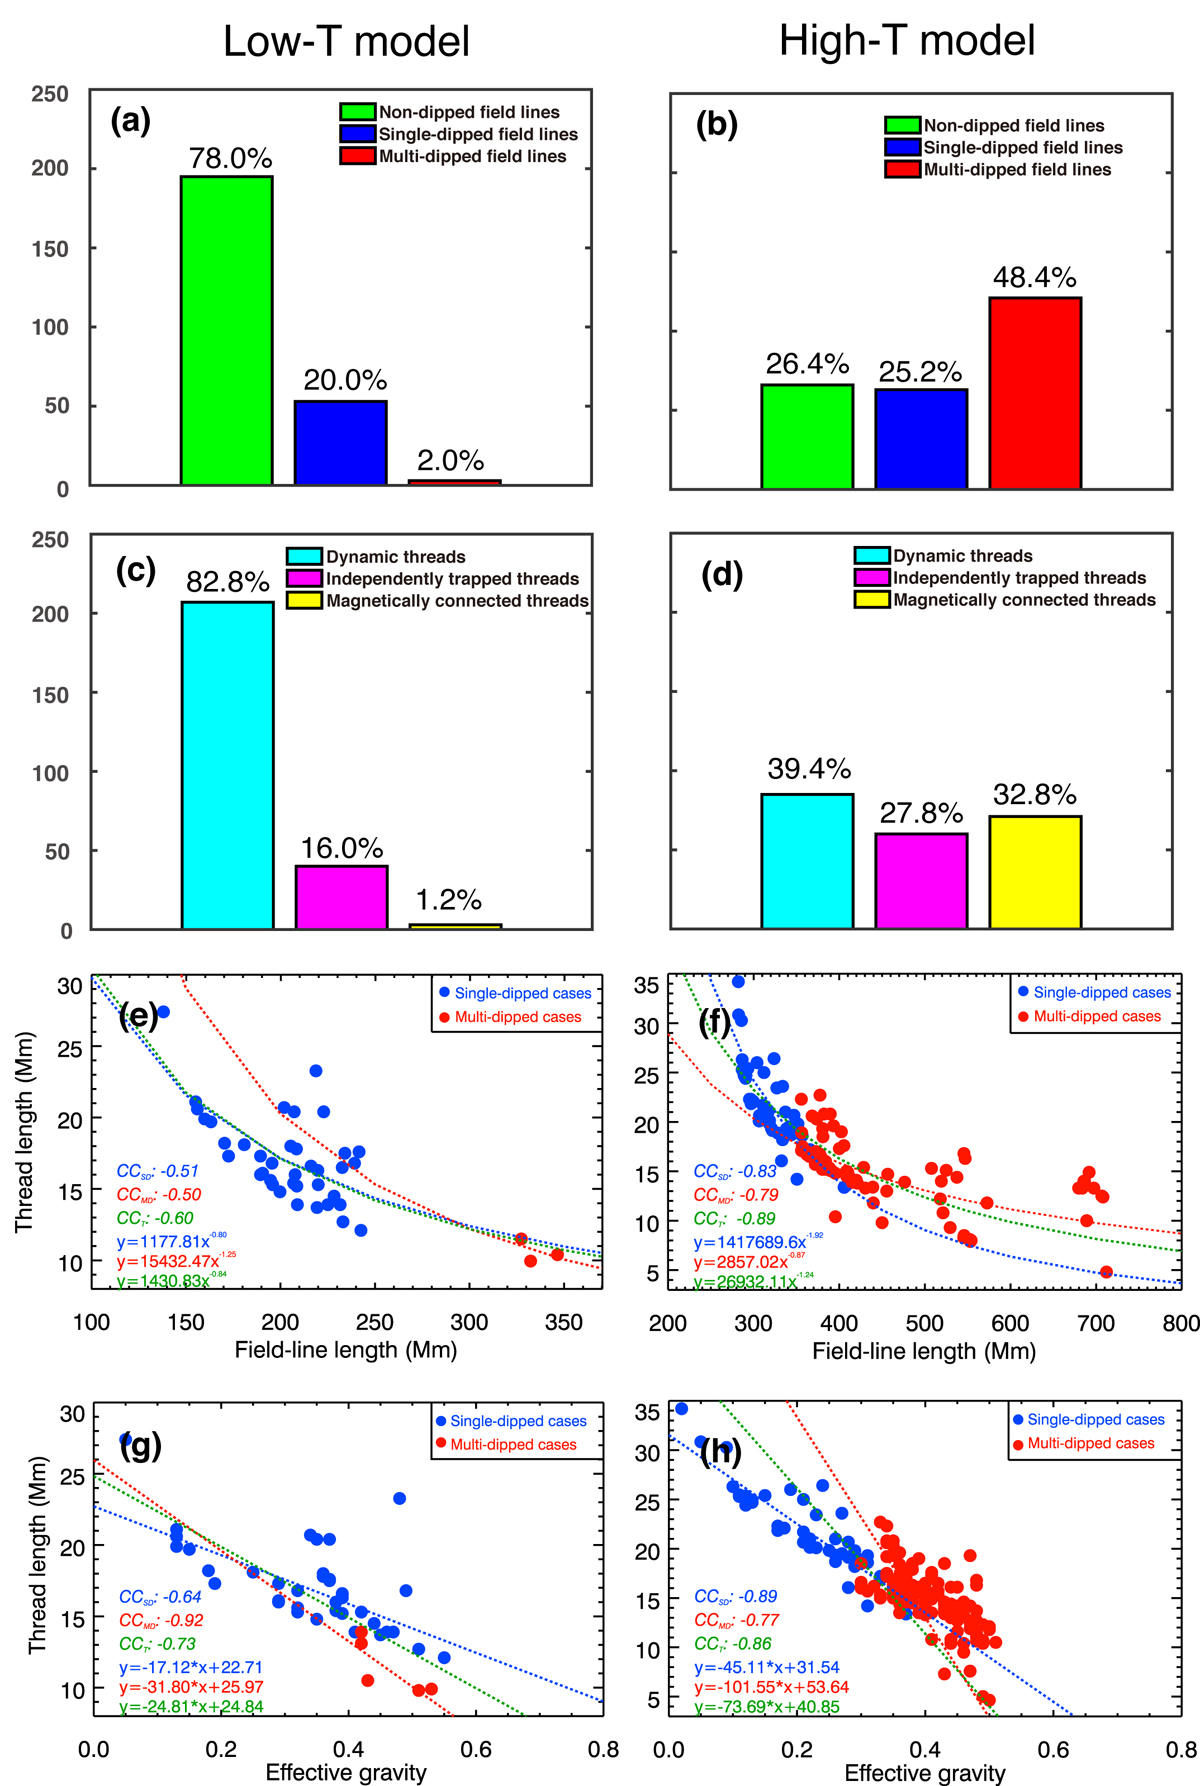
Fig. 5.

Download original image
Statistical results of magnetic dip and thread characteristics in the Low-T (left column) and High-T (right column) models. Panels a, b: fractions of different types of magnetic field lines; panels c, d: fractions of different types of threads; panels e, f: scatter plots of the field-line length versus mean thread length; panels g, h: scatter plots of the effective gravity of the dip versus the thread length. The blue solid circles denote the single-dipped cases, and the red solid circles denote the multidipped cases. The dashed lines marked in blue, red, and green display the fittings to single-dipped cases, multidipped cases, and all data points, respectively.
Current usage metrics show cumulative count of Article Views (full-text article views including HTML views, PDF and ePub downloads, according to the available data) and Abstracts Views on Vision4Press platform.
Data correspond to usage on the plateform after 2015. The current usage metrics is available 48-96 hours after online publication and is updated daily on week days.
Initial download of the metrics may take a while.


