Open Access
Fig. 9.
Download original image
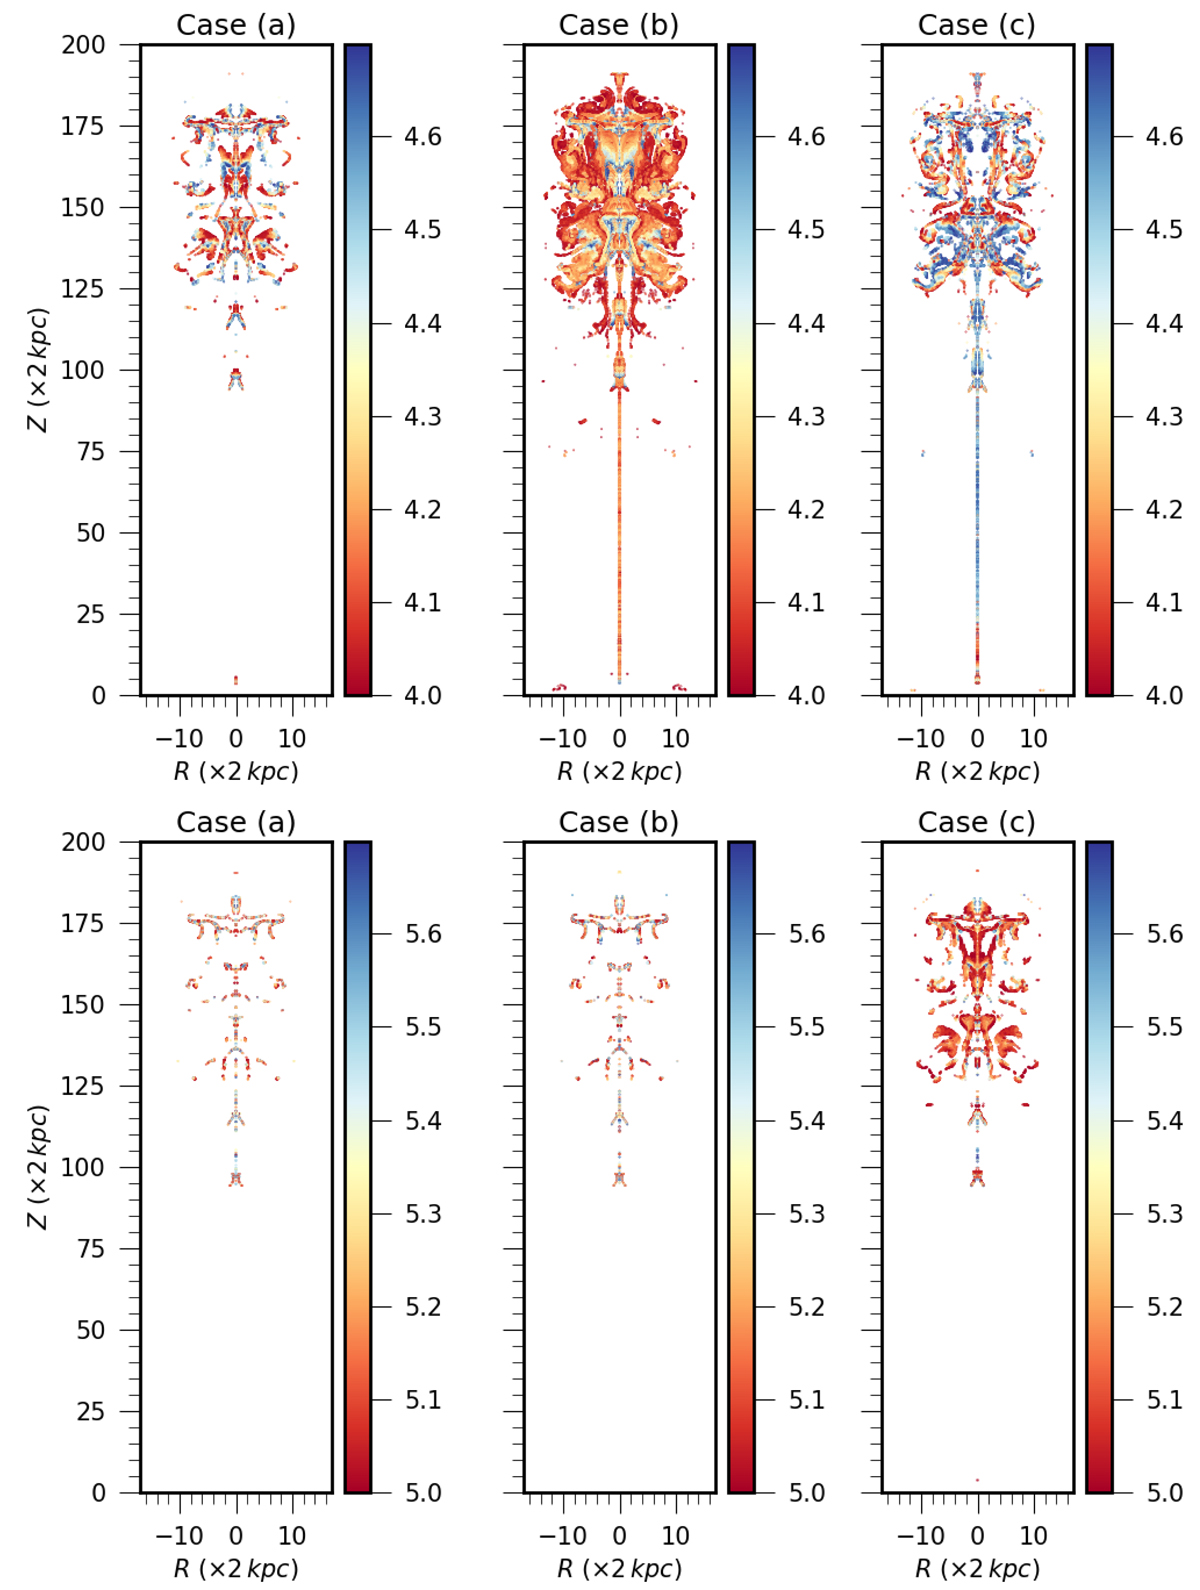
Spatial distribution of the particles responsible for the peaks in SED. Top panel: position of the particle population with γmax ∼ 104 for case (a) (left), case (b) (middle), and case (c) (right). Bottom panel: position of the particle population with γmax ∼ 105 for case (a) (left), case (b) (middle), and case (c) (right).
Current usage metrics show cumulative count of Article Views (full-text article views including HTML views, PDF and ePub downloads, according to the available data) and Abstracts Views on Vision4Press platform.
Data correspond to usage on the plateform after 2015. The current usage metrics is available 48-96 hours after online publication and is updated daily on week days.
Initial download of the metrics may take a while.