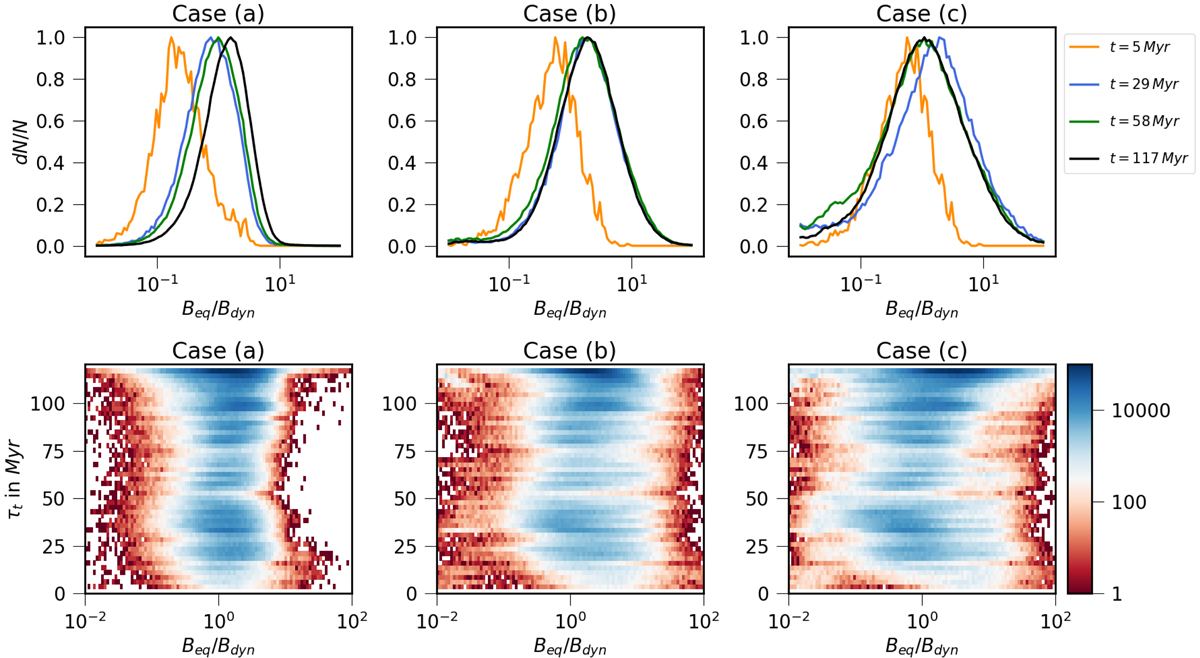
Fig. 7.
Download original image
Histogram of macro-particles with respect to Beq/Bdyn to further study the effect of STA on the macro-particle population. The histograms are normalized and then scaled with the maximum value. Top panel: histograms for three different cases at four different times (color-coded, see inset at right). The top left, middle, and right panels show the histogram for cases (a), (b), and (c), respectively. Bottom panel: two-dimensional histograms showing τt vs. Beq/Bdyn at the final time t = 117 Myr for three cases. The bottom left, middle, and right panels show the histogram for cases (a), (b), and (c), respectively. The color bar at the bottom panel shows the number of macro-particles.
Current usage metrics show cumulative count of Article Views (full-text article views including HTML views, PDF and ePub downloads, according to the available data) and Abstracts Views on Vision4Press platform.
Data correspond to usage on the plateform after 2015. The current usage metrics is available 48-96 hours after online publication and is updated daily on week days.
Initial download of the metrics may take a while.