Open Access
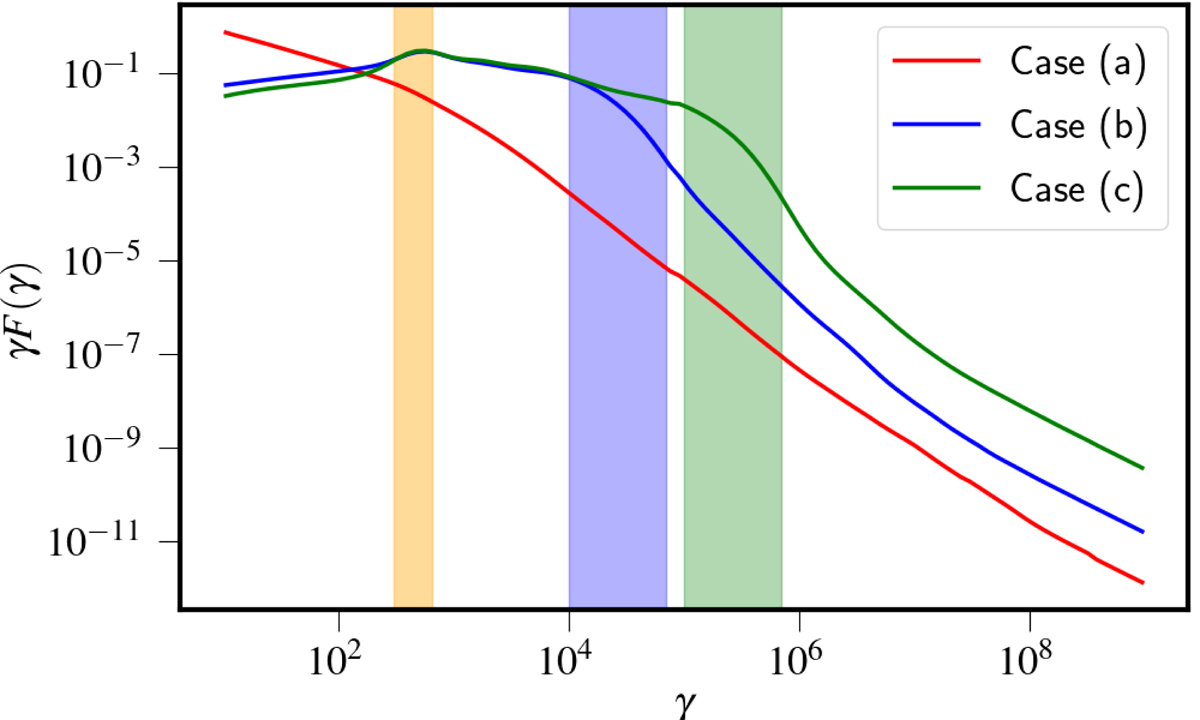
Fig. 6.
Download original image
Integrated spectrum of the entire macro-particle population for the three cases. The portion of the spectrum highlighted in orange corresponds to the low-energy break. The highlighted portions of the spectrum in blue and green correspond to the high-energy cutoff for case (b) and (c), respectively.
Current usage metrics show cumulative count of Article Views (full-text article views including HTML views, PDF and ePub downloads, according to the available data) and Abstracts Views on Vision4Press platform.
Data correspond to usage on the plateform after 2015. The current usage metrics is available 48-96 hours after online publication and is updated daily on week days.
Initial download of the metrics may take a while.