Fig. 3.
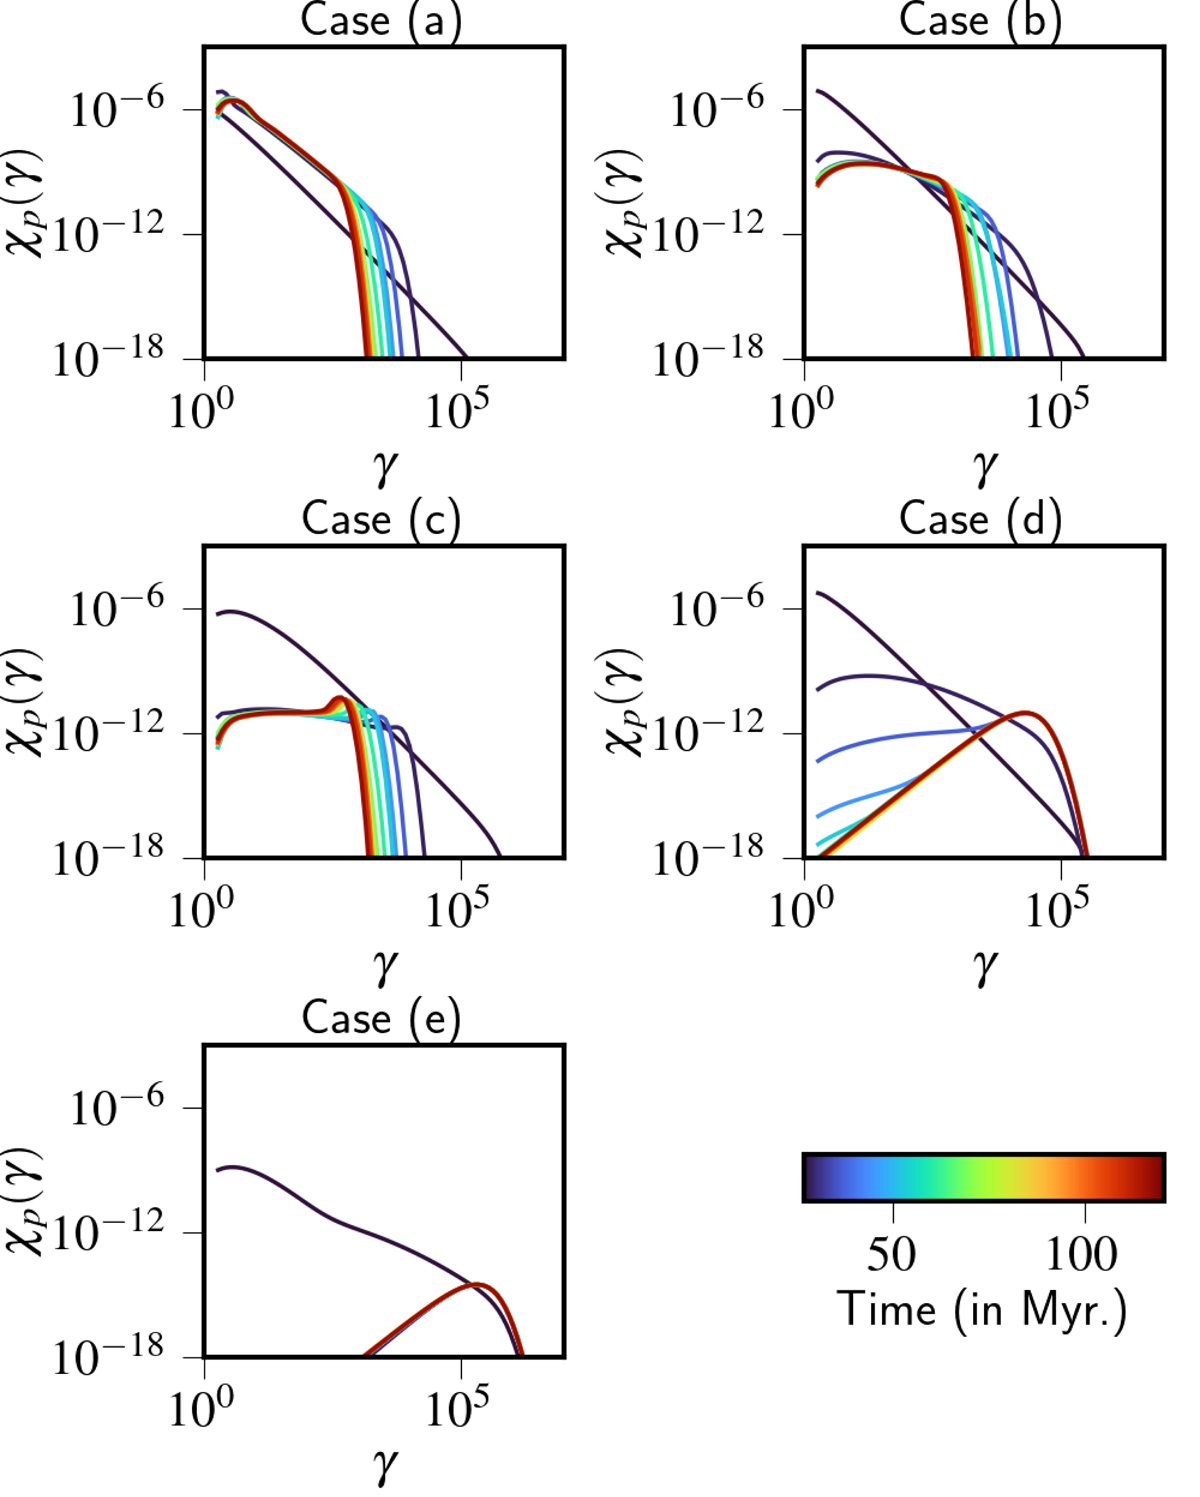
Download original image
Evolution of the energy spectrum for a randomly chosen macro-particle for all the cases described in Table 1. The macro-particle encountered shock at a dynamical time of t = 25 Myr. The color bar shows how much time has elapsed since the simulation began. The value of the lower end of the color bar is set to the time when the macro-particle encountered the final shock.
Current usage metrics show cumulative count of Article Views (full-text article views including HTML views, PDF and ePub downloads, according to the available data) and Abstracts Views on Vision4Press platform.
Data correspond to usage on the plateform after 2015. The current usage metrics is available 48-96 hours after online publication and is updated daily on week days.
Initial download of the metrics may take a while.