Open Access
Fig. B.2
Download original image
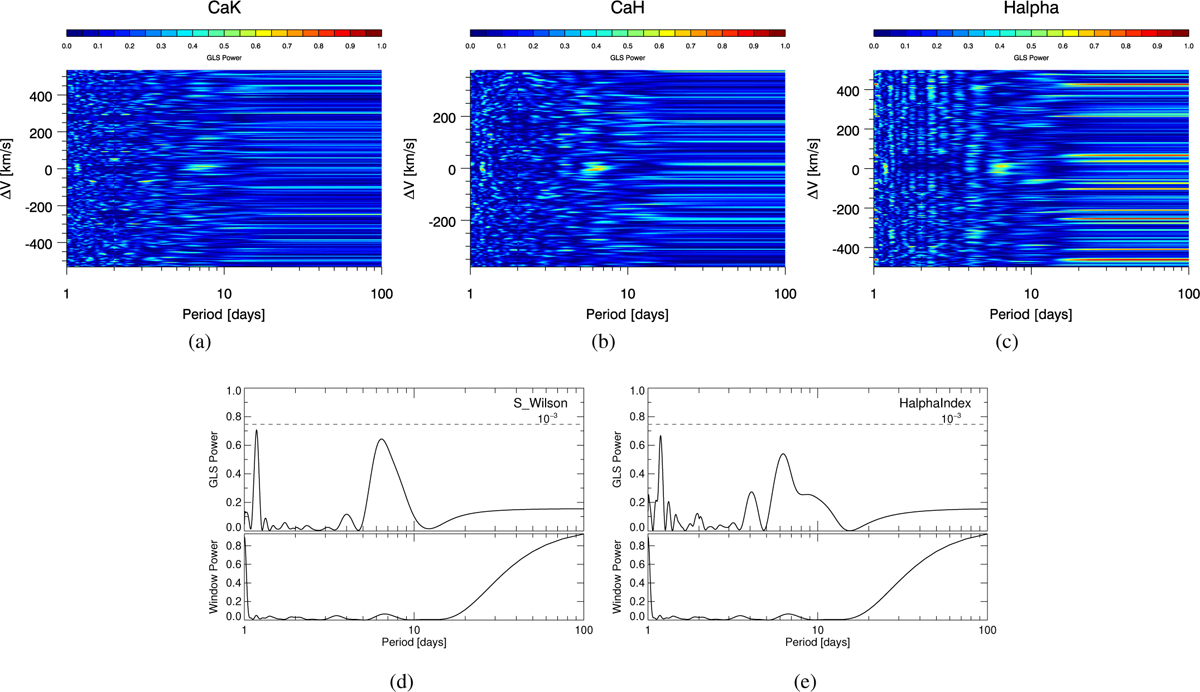
(a-c) 2D GLS periodograms of Ca II K, H, and Hα. (d) GLS periodogram of the S -index based on flux measurements of Ca II H&K. (e) GLS periodogram of the Hα index. All three lines display a clear variability of HD 38949 on a time scale of 6–7 days.
Current usage metrics show cumulative count of Article Views (full-text article views including HTML views, PDF and ePub downloads, according to the available data) and Abstracts Views on Vision4Press platform.
Data correspond to usage on the plateform after 2015. The current usage metrics is available 48-96 hours after online publication and is updated daily on week days.
Initial download of the metrics may take a while.