Fig. B.1
Download original image
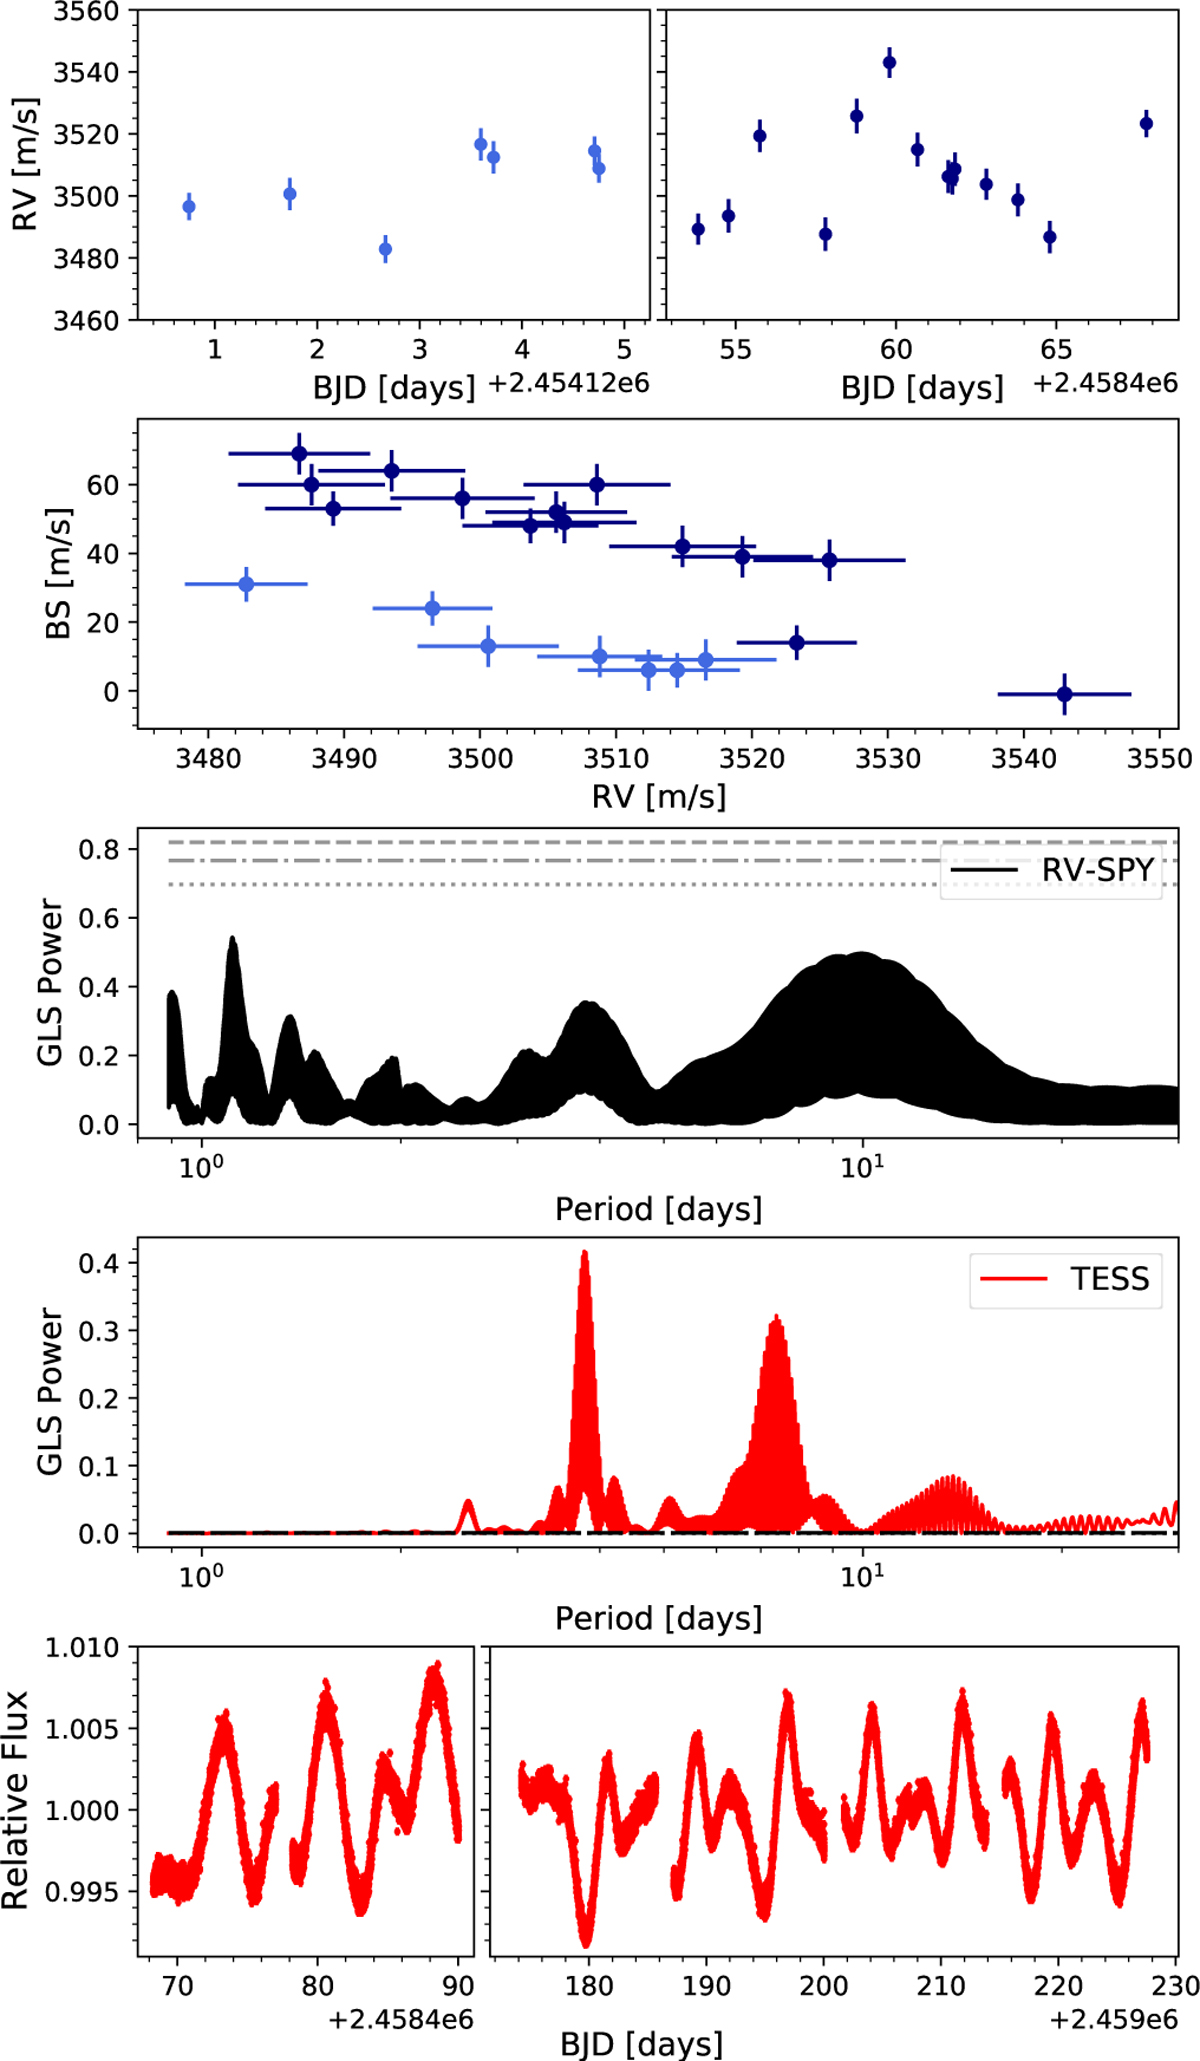
RVSPY and TESS data for HD 38949. The panels show (from top to bottom): the RV time series, the relation between RV and BS, the GLS periodograms of the RVs and of the photometric data (measured by TESS), and the TESS time series. All data products of the RVSPY programme are shown in black, all TESS data products are shown in red. Horizontal lines in the GLS periodogram of RVs reflect the 0.1%, 1% and 10% false alarm probabilities (from top to bottom). The corresponding false alarm probabilities of the TESS data GLS periodogram are all merged in the dashed line at the bottom of the periodogram, owing to the large number of the TESS data points.
Current usage metrics show cumulative count of Article Views (full-text article views including HTML views, PDF and ePub downloads, according to the available data) and Abstracts Views on Vision4Press platform.
Data correspond to usage on the plateform after 2015. The current usage metrics is available 48-96 hours after online publication and is updated daily on week days.
Initial download of the metrics may take a while.