Fig. 1
Download original image
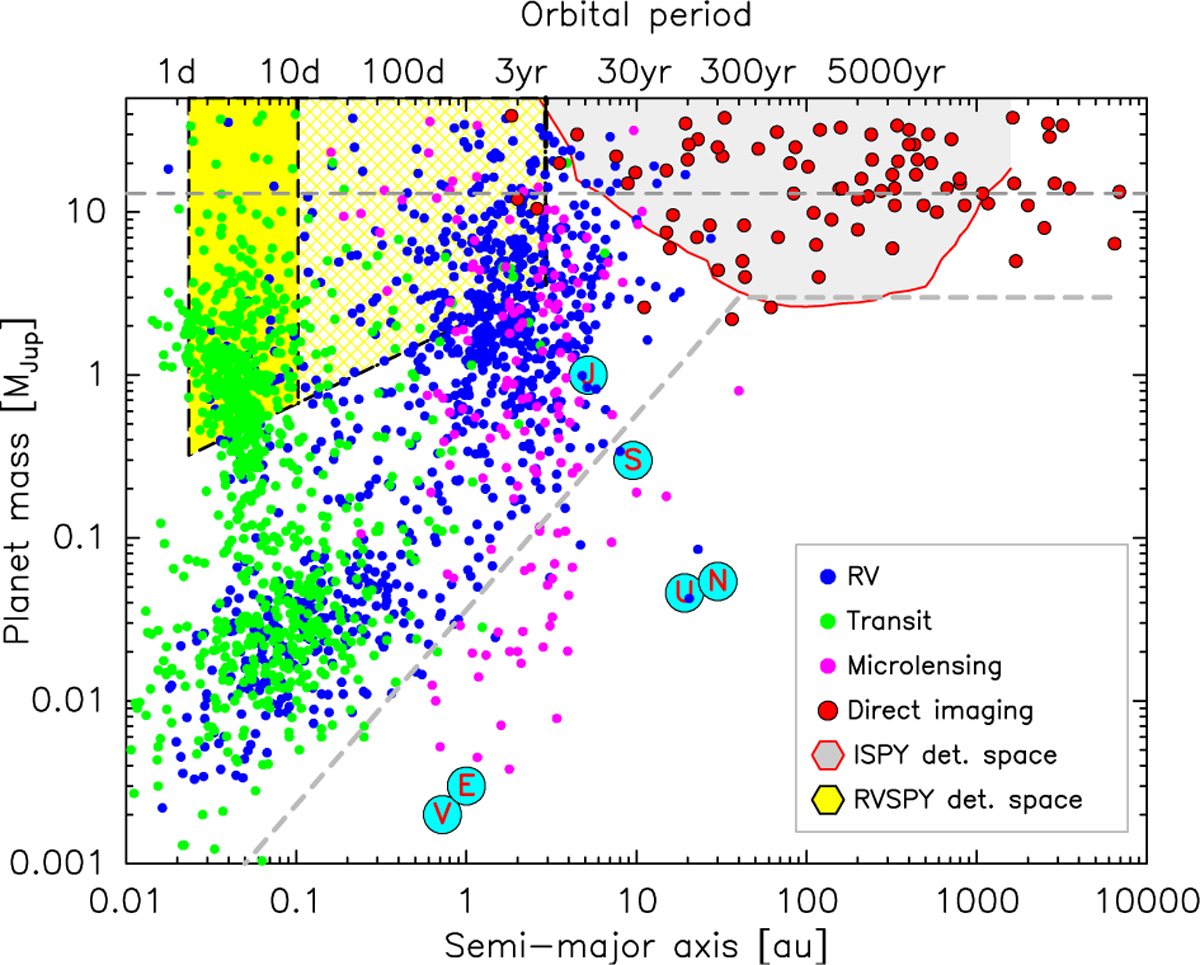
Distribution of planet mass vs. orbital separation of confirmed exoplanets as listed on exopolanet.eu (January 2022, Schneider et al. 2011). Labelled on top are the corresponding orbital periods for M* = 1 M⊙ and Mp << M*. The main detection methods are marked by different colours. Solar System planets are represented by cyan circles and red letters. The horizontal dashed line marks the approximate deuterium burning mass limit. The solid yellow-shaded area marks the parameter space probed by our high-cadence RVSPY survey, assuming a conservative mean 3σ-sensitivity of 60 m s−1 (Sect. 6.2) and a mean stellar mass of 1 M0. The yellow-hatched area marks the extended detection space probed by our RVSPY survey assuming a long-term monitoring duration of 5 yr. The grey-shaded area marks the parameter space probed by the NACO-ISPY survey (10% detection probability, Launhardt et al. 2020). The light-grey dashed line marks the approximate detection threshold of current-day exoplanet searches.
Current usage metrics show cumulative count of Article Views (full-text article views including HTML views, PDF and ePub downloads, according to the available data) and Abstracts Views on Vision4Press platform.
Data correspond to usage on the plateform after 2015. The current usage metrics is available 48-96 hours after online publication and is updated daily on week days.
Initial download of the metrics may take a while.