Fig. 1
Download original image
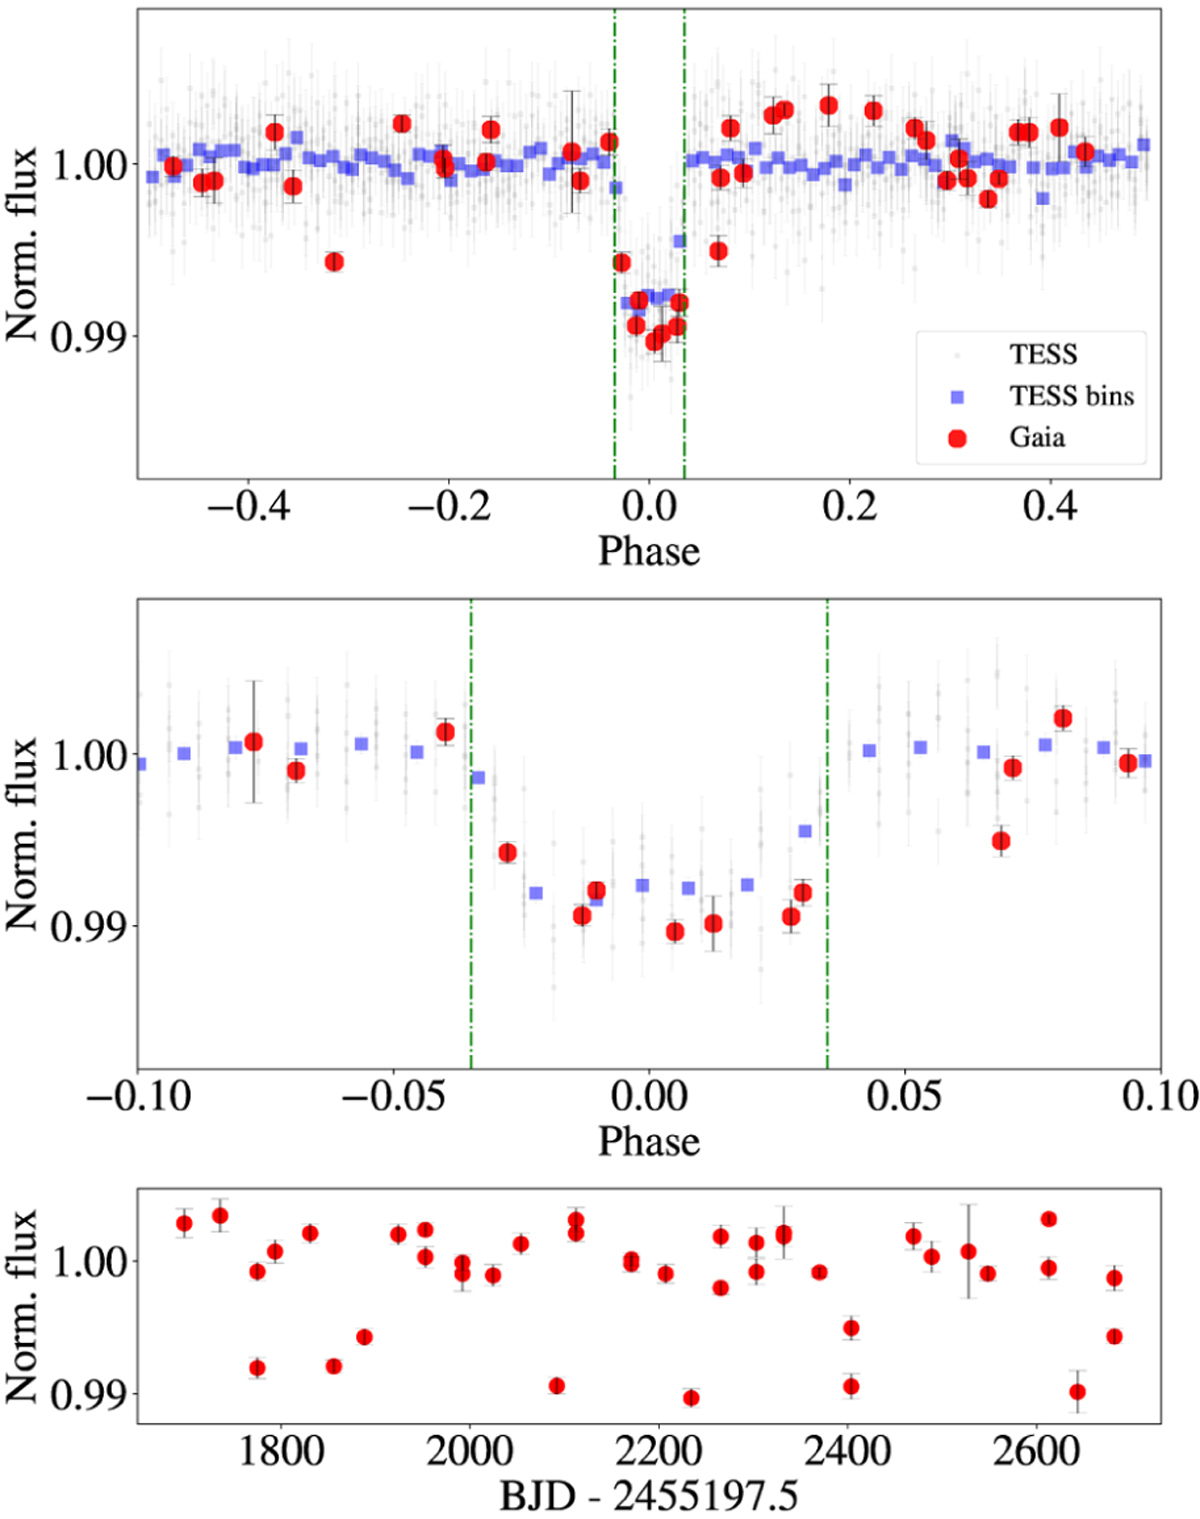
On-target confirmation of TOI-4034. Top: Gaia and TESS light curves of TOI-4034, phase folded with a period of P = 1.80209590 days. Middle: zoomed-in view of the transit. Bottom: unfolded Gaia light curve. The Gaia light curves are marked by red circles, the TESS light curves are marked by light-gray squares, and the bins by blue squares. The duration of the transit, as reported by TESS, is marked by two vertical green dashed lines.
Current usage metrics show cumulative count of Article Views (full-text article views including HTML views, PDF and ePub downloads, according to the available data) and Abstracts Views on Vision4Press platform.
Data correspond to usage on the plateform after 2015. The current usage metrics is available 48-96 hours after online publication and is updated daily on week days.
Initial download of the metrics may take a while.