Fig. 7
Download original image
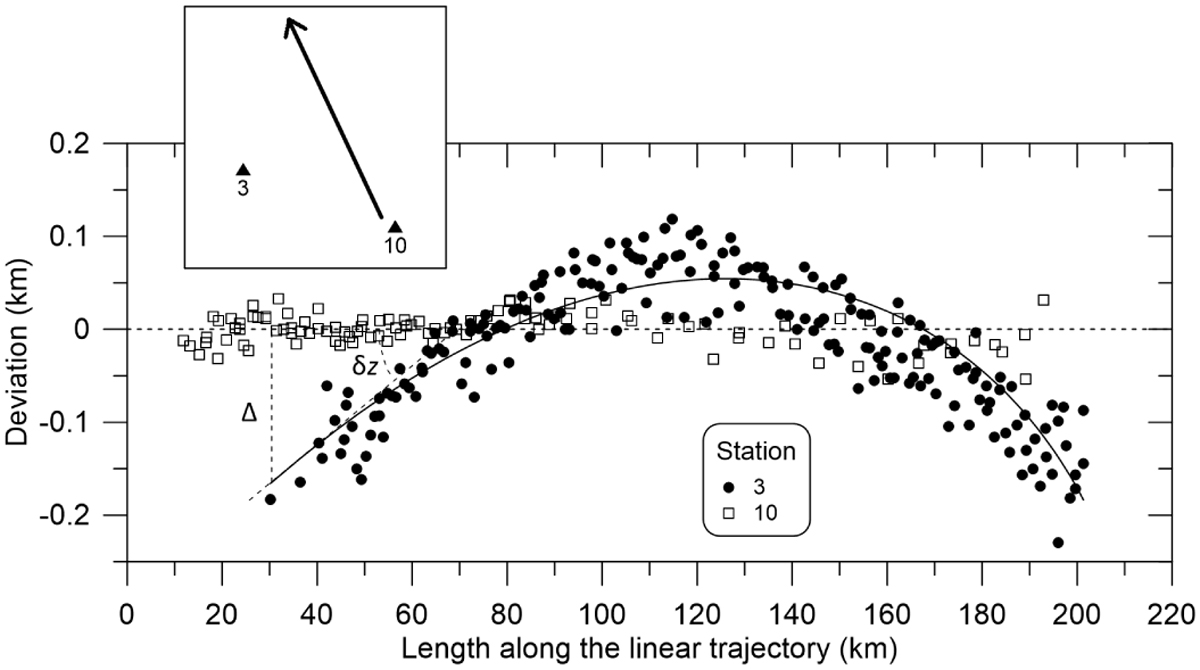
Deviations of lines of sight from the straight trajectory solution for fireball EN161216_182218. Data from the two closest stations, numbers 3 and 10, are shown. The inset shows the relative positions of the stations and the fireball trajectory in a ground projection sketch. The fireball entered the atmosphere with a slope of 13° to the horizontal plane and a velocity of 14.7 km s−1. The velocity was measurable for a period of 13.7 s over a trajectory length of 185 km. It decreased to 8.6 km s−1 at the end. The curved line shows the expected deviation ∆ from the straight trajectory in the vertical plane due to gravity. The angle δz is the difference between the actual radiant, which changes along the trajectory, and the radiant from the straight trajectory solution. We note that the scale of the vertical axis is exaggerated.
Current usage metrics show cumulative count of Article Views (full-text article views including HTML views, PDF and ePub downloads, according to the available data) and Abstracts Views on Vision4Press platform.
Data correspond to usage on the plateform after 2015. The current usage metrics is available 48-96 hours after online publication and is updated daily on week days.
Initial download of the metrics may take a while.