Fig. A.3.
Download original image
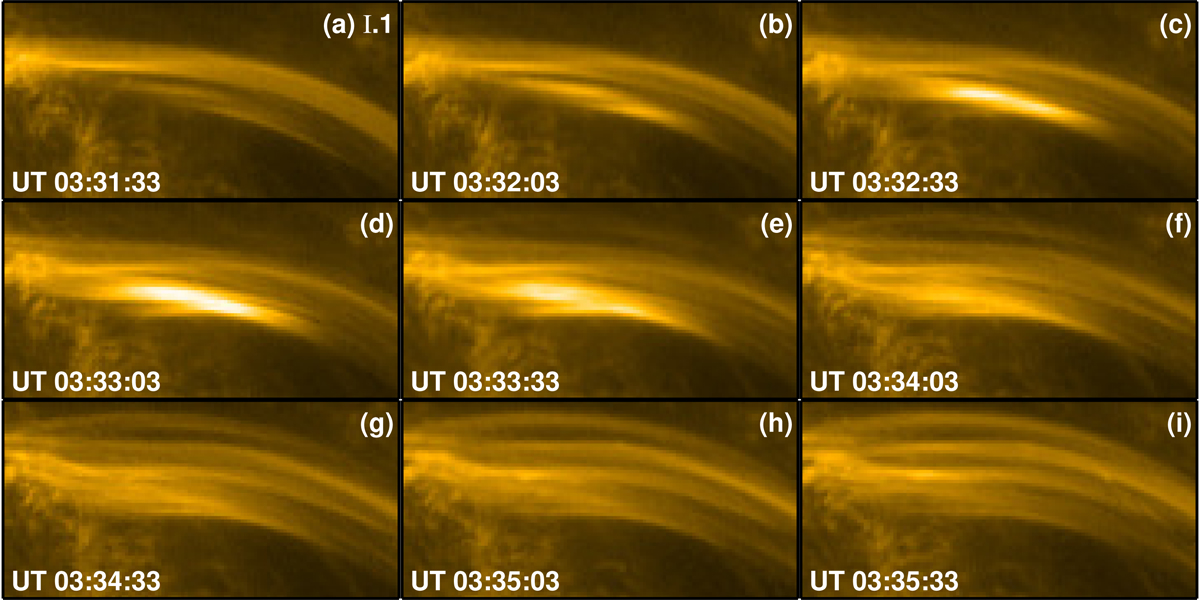
Image sequence showing the evolution of braided loops in Fig. 2. The subsequent panels are 30 s apart, and the sequence reveals the relaxation of braided coronal loops from an apparently braided to an untangled state. The intensity of the displayed images is on a square-root scale. See Sect. 3 for a discussion.
Current usage metrics show cumulative count of Article Views (full-text article views including HTML views, PDF and ePub downloads, according to the available data) and Abstracts Views on Vision4Press platform.
Data correspond to usage on the plateform after 2015. The current usage metrics is available 48-96 hours after online publication and is updated daily on week days.
Initial download of the metrics may take a while.