Fig. A.1
Download original image
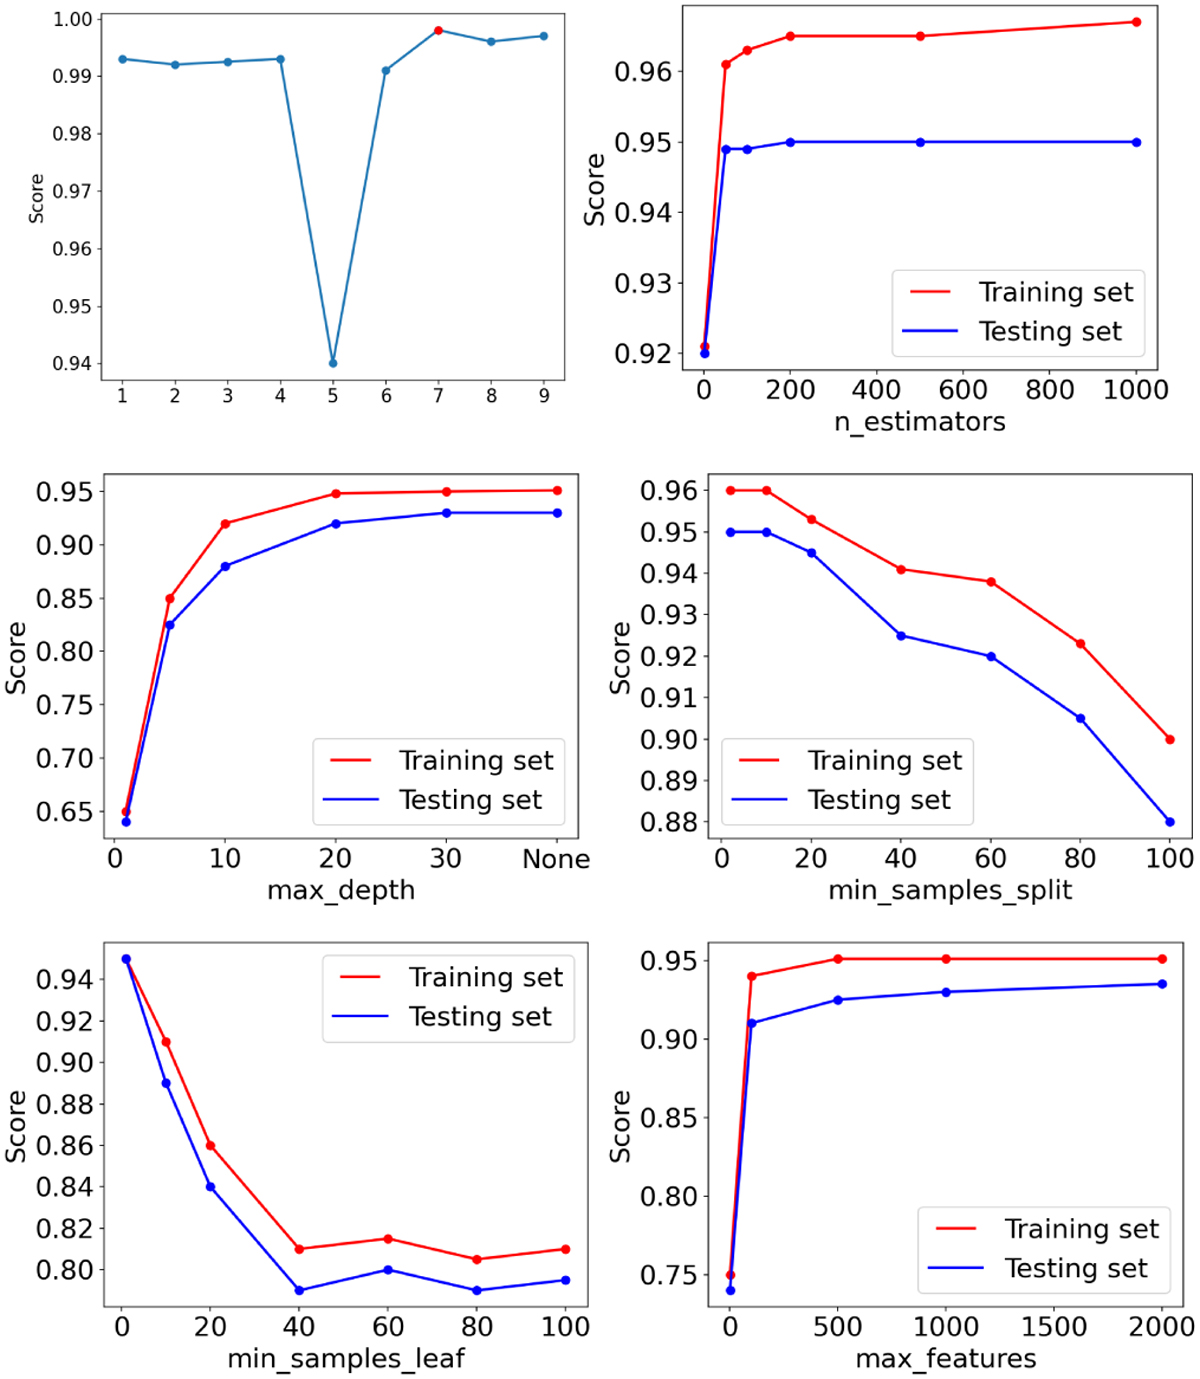
Performance of the accuracy score as a function of different hyperparameters for the training sample (red line) and testing sample (blue line). In the top left panel we show the accuracy for different scalers: standard (1), MinMax (2), MaxAbs (3), robust (4), power transformer (5), quantile transformer (6), normalizer L1 (7), normalizer L2 (8), and normalizer-max (9). Marked in red (7) the one adopted in the present work.
Current usage metrics show cumulative count of Article Views (full-text article views including HTML views, PDF and ePub downloads, according to the available data) and Abstracts Views on Vision4Press platform.
Data correspond to usage on the plateform after 2015. The current usage metrics is available 48-96 hours after online publication and is updated daily on week days.
Initial download of the metrics may take a while.