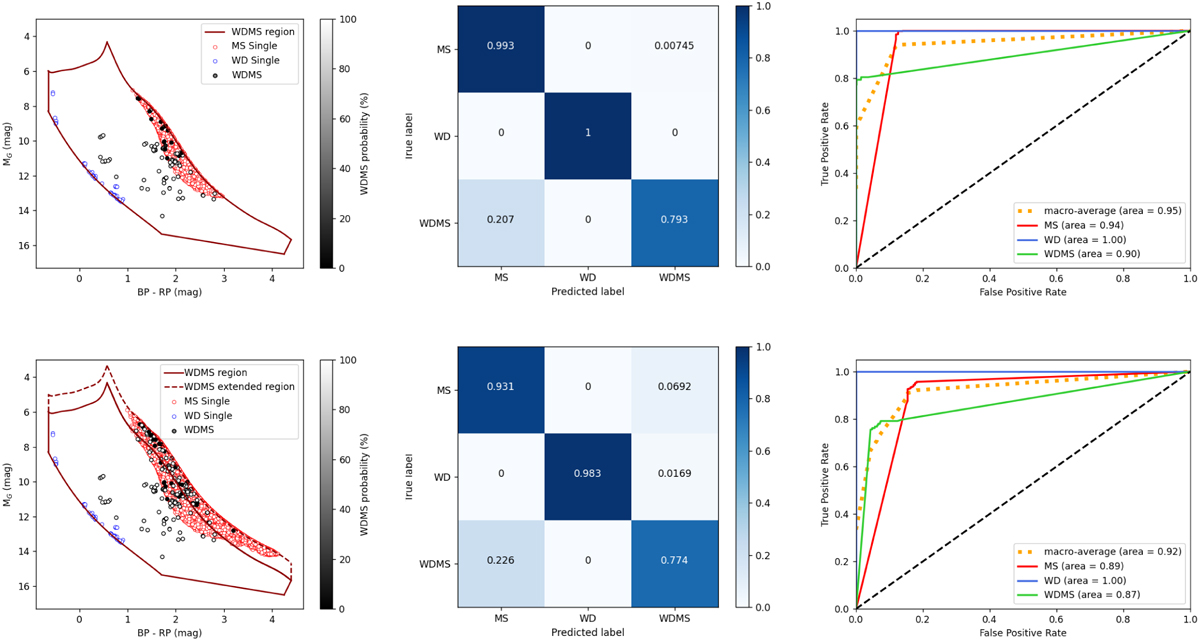
Fig. 12
Download original image
HR-diagram, confusion matrices, and ROC curves. Top panels: HR-diagram (left panel) of WDs (blue open circles), MS stars (red open circles), and WDMS systems (grey solid circles) for those spectra with G < 18 accessible by Gaia within the WDMS region (red solid line) defined by Rebassa-Mansergas et al. (2021). The performance of our Random Forest in classifying these population is shown in the corresponding confusion matrix (middle panel) and the ROC curve (right panel). Bottom panels: same as previous panels when the region defined by Rebassa-Mansergas et al. (2021) is extended 1 mag up into the MS region (red dashed line). Even in those extreme conditions the algorithm is able to identify ~60% of WDMS binary systems within the extended region (see text for details).
Current usage metrics show cumulative count of Article Views (full-text article views including HTML views, PDF and ePub downloads, according to the available data) and Abstracts Views on Vision4Press platform.
Data correspond to usage on the plateform after 2015. The current usage metrics is available 48-96 hours after online publication and is updated daily on week days.
Initial download of the metrics may take a while.