Open Access
Fig. A.1
Download original image
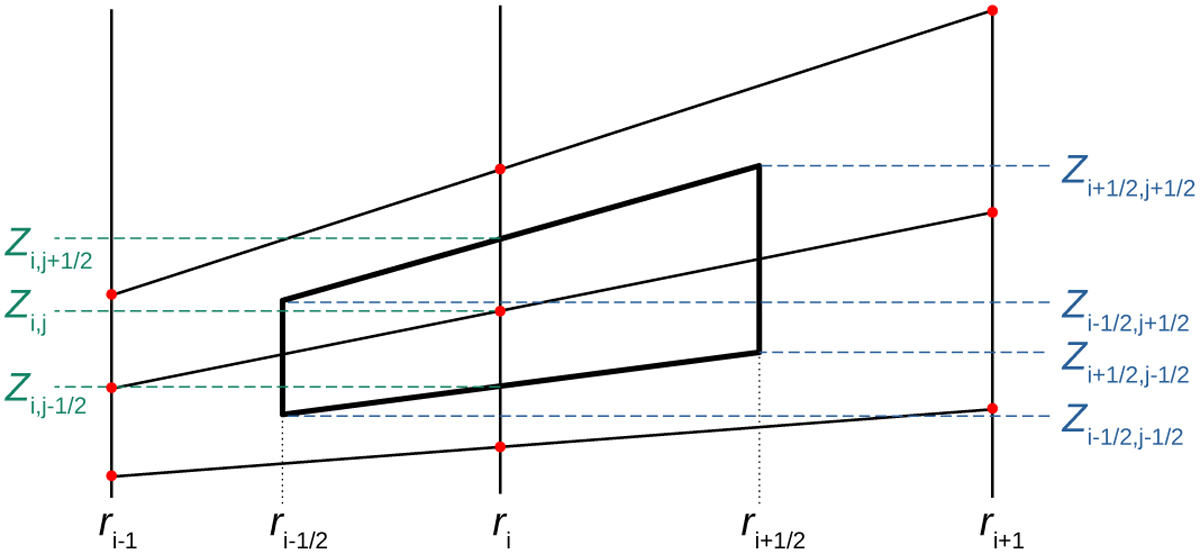
Volume and areas for the spatial cell around point (i, j). The mean intensities J and Rosseland opacities κR are available on the grid points (i, j) marked with red dots.
Current usage metrics show cumulative count of Article Views (full-text article views including HTML views, PDF and ePub downloads, according to the available data) and Abstracts Views on Vision4Press platform.
Data correspond to usage on the plateform after 2015. The current usage metrics is available 48-96 hours after online publication and is updated daily on week days.
Initial download of the metrics may take a while.