Fig. 8
Download original image
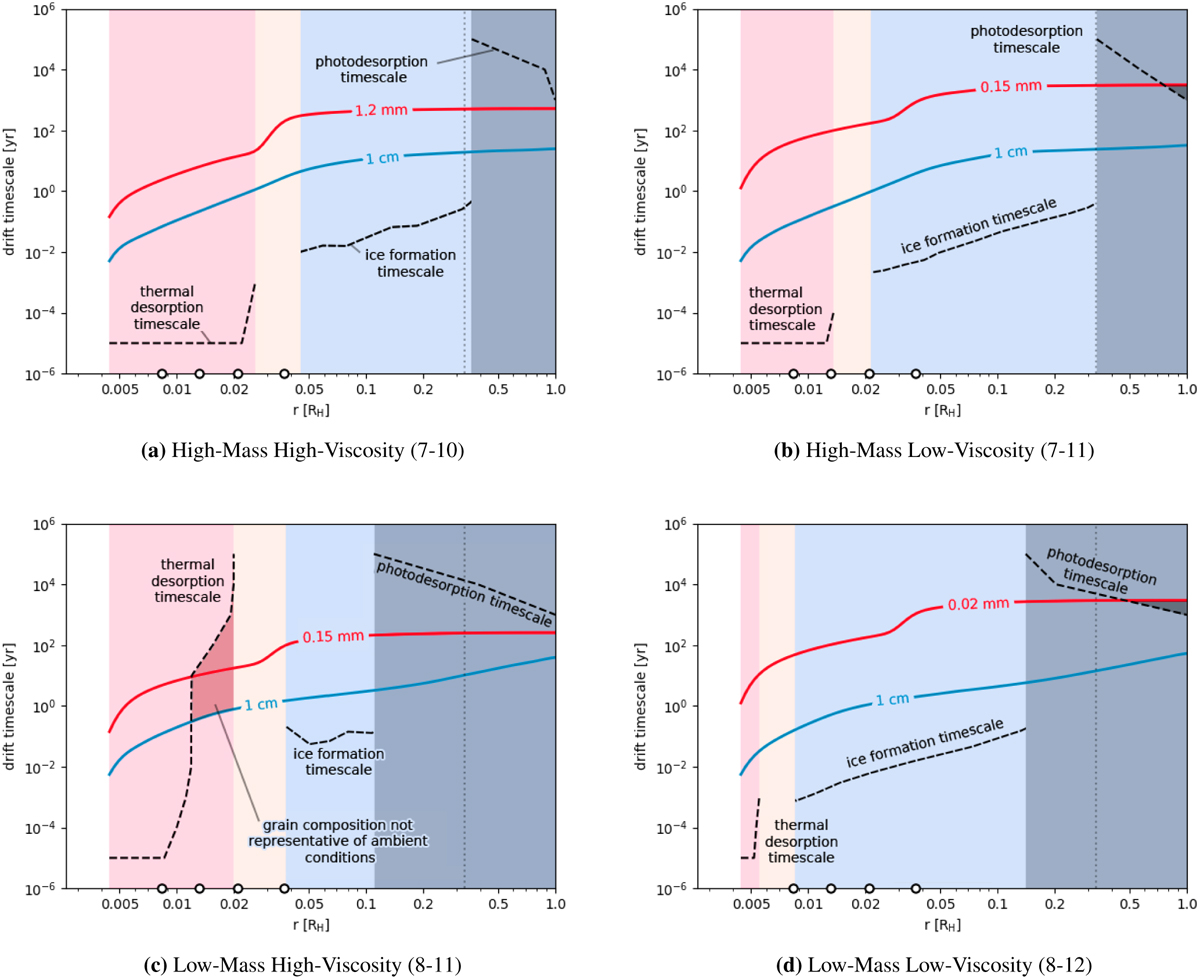
Inwards drift timescale for dust grains (colored lines) relative to the timescales of desorption and ice formation (black dashed lines) in the reference CPDs with d/g = 10−33. From left to right the colored regions correspond to areas where all ices are eventually thermally desorbed (pink), the iceline (light yellow), where grains become icier (light blue) and where all ices are eventually photodesorbed (dark gray). The red line corresponds to the minimum grain size which is not trapped in the CPD (if there is a sign change in the gas radial velocity) and the blue line to the maximum for which the timescales of desorption and ice formation have been verified. The vertical dotted line indicates the approximate outer region of gravitational stability in the CPD.
Current usage metrics show cumulative count of Article Views (full-text article views including HTML views, PDF and ePub downloads, according to the available data) and Abstracts Views on Vision4Press platform.
Data correspond to usage on the plateform after 2015. The current usage metrics is available 48-96 hours after online publication and is updated daily on week days.
Initial download of the metrics may take a while.