Fig. 5
Download original image
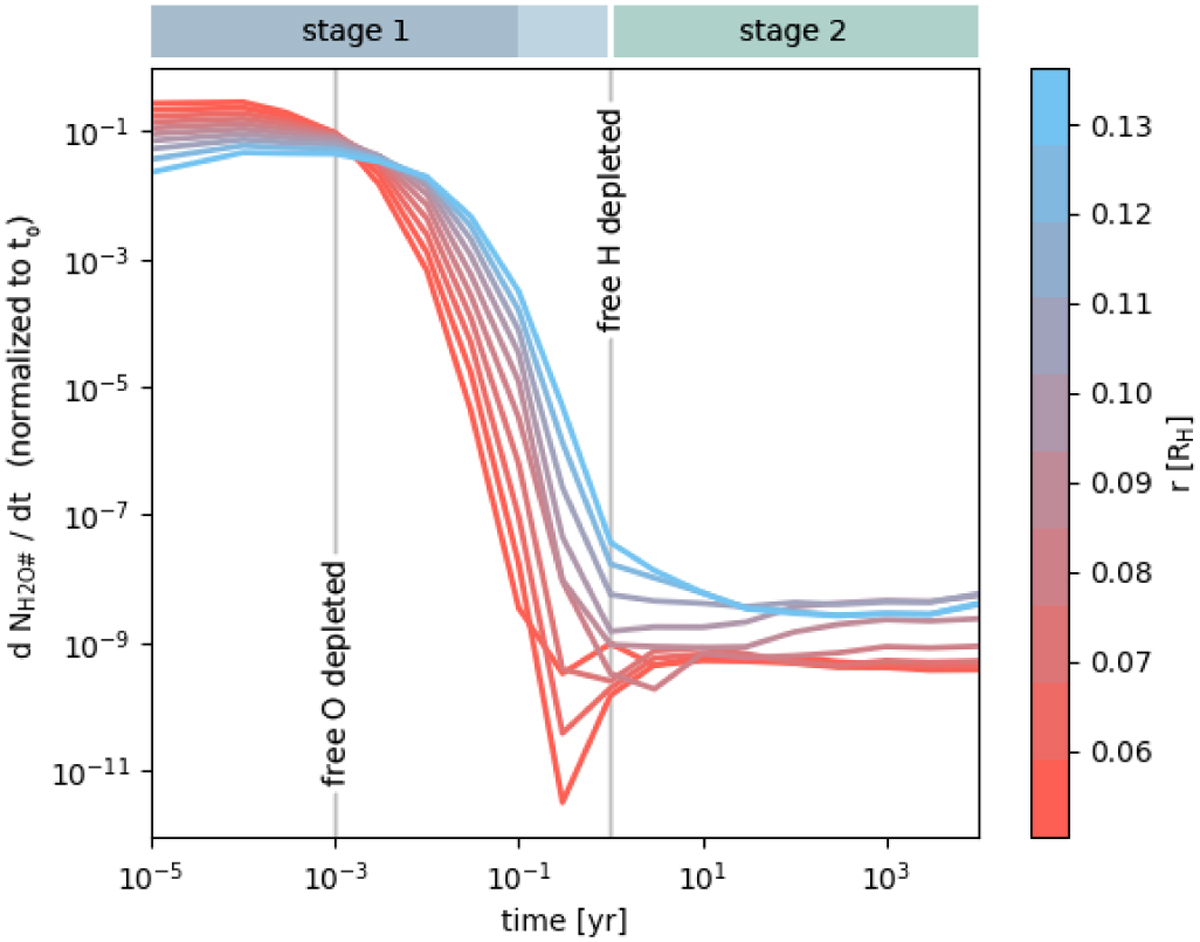
Rate of water ice formation as a function of time at different radii beyond the snowline in the high-mass, high-viscosity CPD (7–10), to illustrate the two distinct stages of water ice formation. All values are normalized to the maximum formation rate at 10−5 yr, r = 0.08 RH. The times where the decline in the abundance of free O and free H end are indicated by the gray vertical lines. The starting time t0 is defined as when the infalling gas is shock-heated to an atomic and ionized state.
Current usage metrics show cumulative count of Article Views (full-text article views including HTML views, PDF and ePub downloads, according to the available data) and Abstracts Views on Vision4Press platform.
Data correspond to usage on the plateform after 2015. The current usage metrics is available 48-96 hours after online publication and is updated daily on week days.
Initial download of the metrics may take a while.