Fig. E.1
Download original image
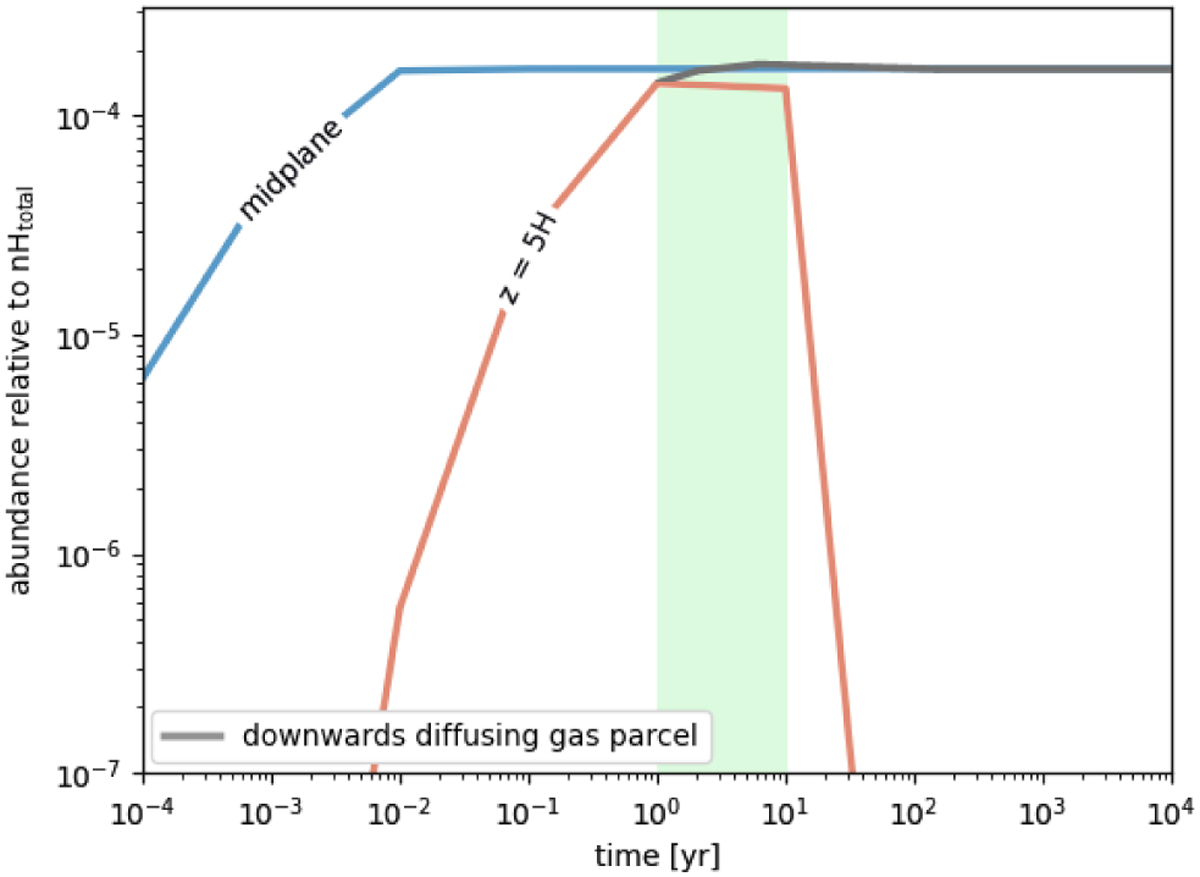
Evolution of the water ice abundance relative to the total number of hydrogen nuclei at the midplane (blue) and at 5 scale heights above the CPD midplane (red), and in the case of the gas parcel which drifts from z = 5H downwards to the midplane over a period of 100 yr (grey). The period in which the altitude of the gas parcel was iteratively lowered towards the midplane is highlighted in light green.
Current usage metrics show cumulative count of Article Views (full-text article views including HTML views, PDF and ePub downloads, according to the available data) and Abstracts Views on Vision4Press platform.
Data correspond to usage on the plateform after 2015. The current usage metrics is available 48-96 hours after online publication and is updated daily on week days.
Initial download of the metrics may take a while.