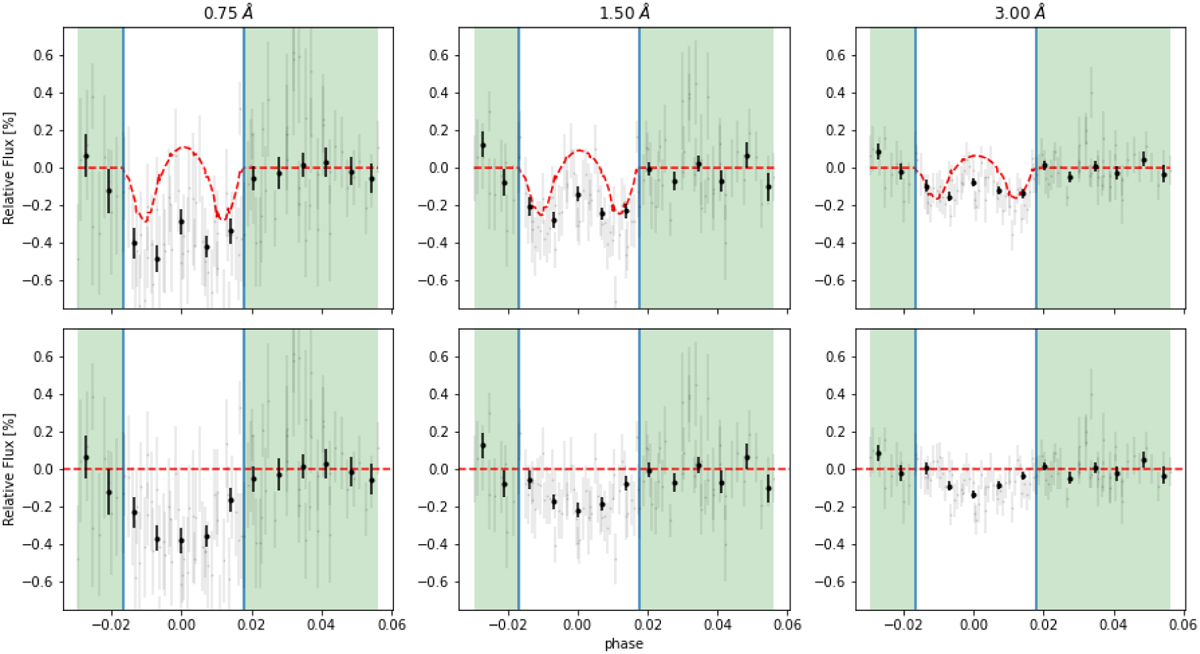
Fig. 9

Download original image
Transmission light curves (TLC) of HD 189733 b for all three nights combined using three different central bandwidths: 0.75 Å (left column), 1.50 Å (middle column) and 3.00 Å (right column). The gray data points show the relative absorption for each exposure; in black the data are binned by 20 spectra. The green background marks the exposures taken out-of-transit. First row: observed TLCs; the red dashed line shows the CLV and RM model. Second row: TLCs after removing the contribution of the CLV and RM effects.
Current usage metrics show cumulative count of Article Views (full-text article views including HTML views, PDF and ePub downloads, according to the available data) and Abstracts Views on Vision4Press platform.
Data correspond to usage on the plateform after 2015. The current usage metrics is available 48-96 hours after online publication and is updated daily on week days.
Initial download of the metrics may take a while.


