Open Access
Fig. 3
Download original image
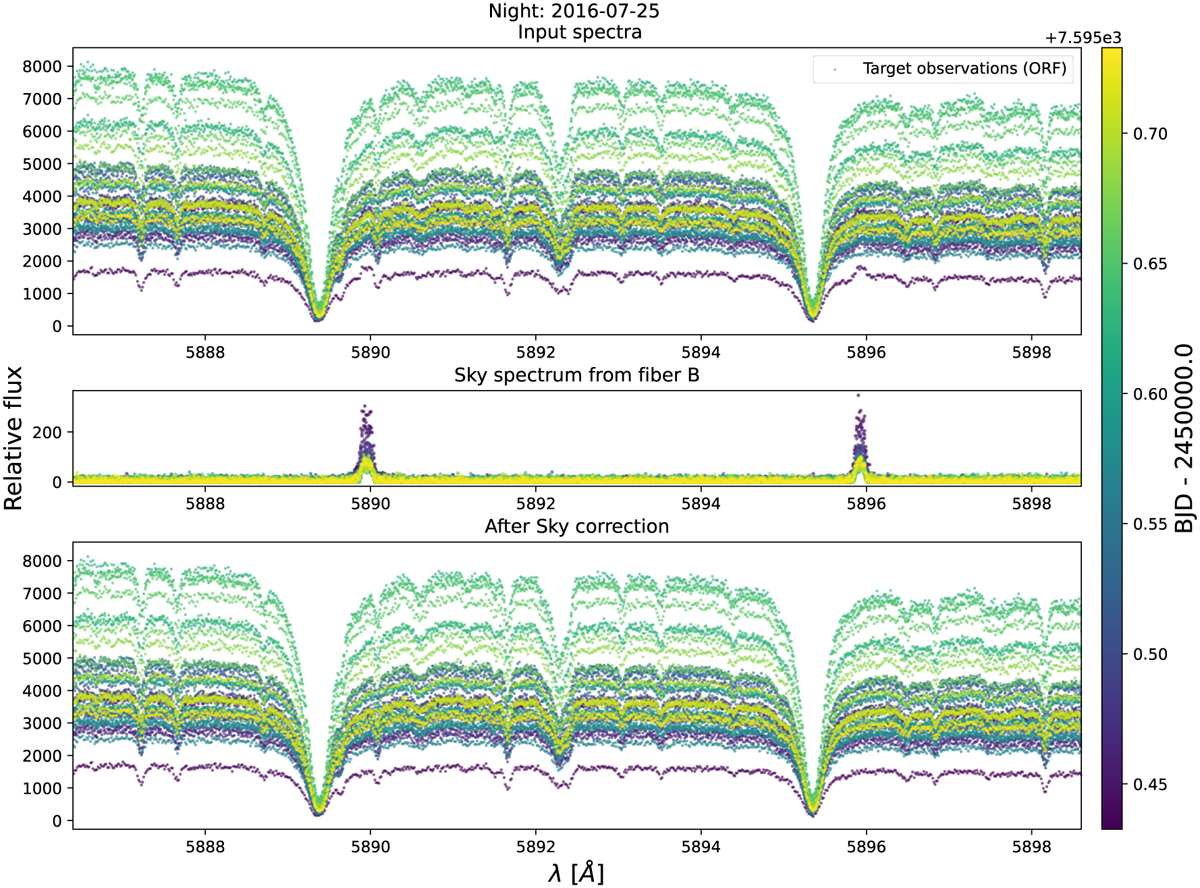
Example of sky correction applied with SLOPpy to a HD 209458 b spectrum in the region of the Na i doublet. Top panel: input spectra from fiber A; middle panel: sky emission spectra from fiber B; bottom panel: corrected spectra. All spectra are color-coded according to the time.
Current usage metrics show cumulative count of Article Views (full-text article views including HTML views, PDF and ePub downloads, according to the available data) and Abstracts Views on Vision4Press platform.
Data correspond to usage on the plateform after 2015. The current usage metrics is available 48-96 hours after online publication and is updated daily on week days.
Initial download of the metrics may take a while.