Fig. 10
Download original image
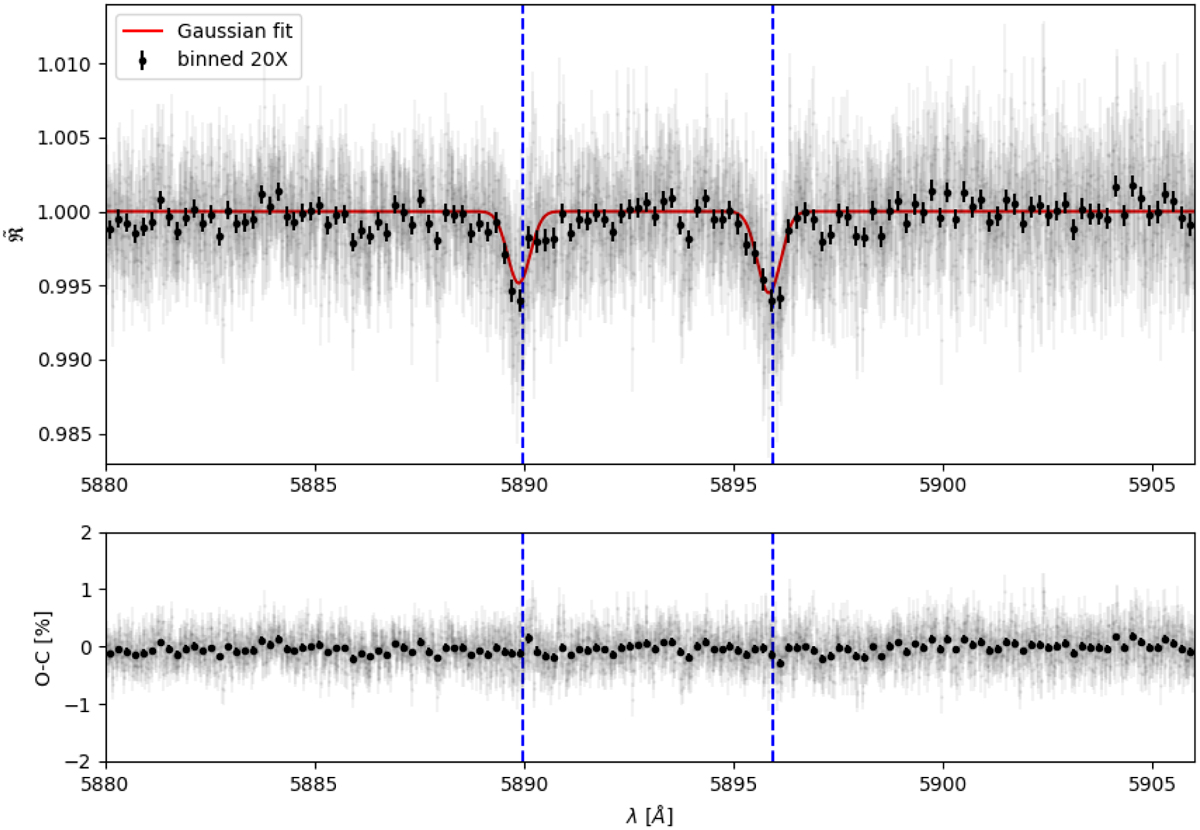
Final transmission spectrum of WASP-76 b centered around the sodium doublet in the planetary rest frame. Upper panel: full-resolution data in light gray, and binned by 20× in black circles. The MCMC Gaussian fit is shown in red, and the rest frame transition wavelengths of the sodium doublet are indicated with blue dashed lines. Lower panel: residuals of the Gaussian fit.
Current usage metrics show cumulative count of Article Views (full-text article views including HTML views, PDF and ePub downloads, according to the available data) and Abstracts Views on Vision4Press platform.
Data correspond to usage on the plateform after 2015. The current usage metrics is available 48-96 hours after online publication and is updated daily on week days.
Initial download of the metrics may take a while.