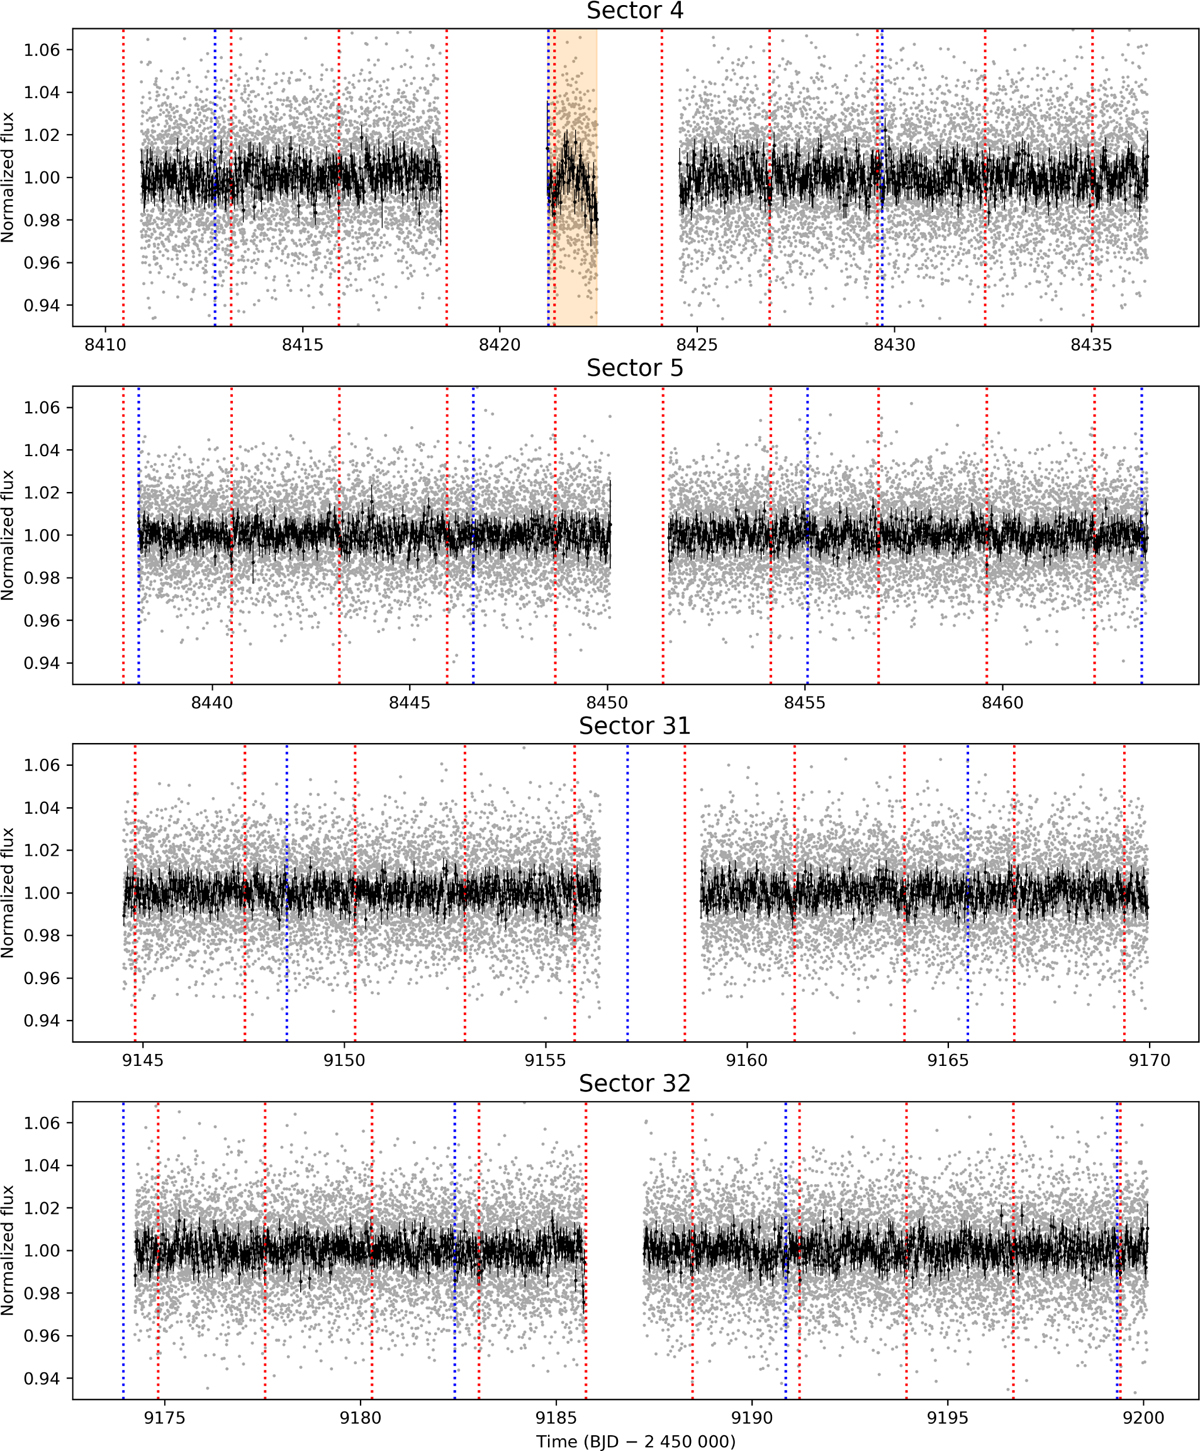
Fig. 2
Download original image
TESS photometry of LP 890-9. For each of the four sectors, the 2-min data points (in grey) have been binned into 30-min intervals to produce the black points, with error bars corresponding to the root-mean-square of the uncertainties of the points in the bins. The transits of LP 890-9 b and c are indicated by red and blue dotted lines, respectively. The region marked in orange in sector 4 was impacted by thermal effects and thus excluded from our analysis.
Current usage metrics show cumulative count of Article Views (full-text article views including HTML views, PDF and ePub downloads, according to the available data) and Abstracts Views on Vision4Press platform.
Data correspond to usage on the plateform after 2015. The current usage metrics is available 48-96 hours after online publication and is updated daily on week days.
Initial download of the metrics may take a while.