Fig. 17
Download original image
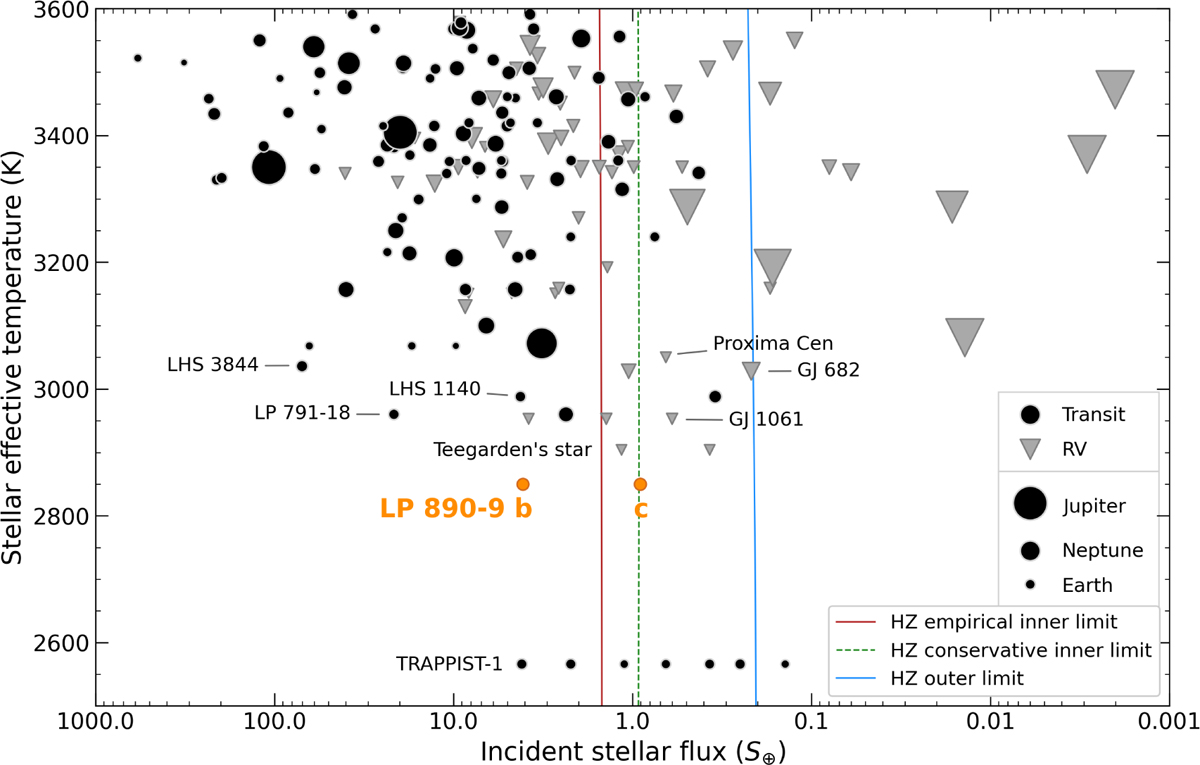
Exoplanets found around cool dwarfs with an effective temperature lower than 3600 K using the transit (black circles) or radial velocity (grey triangles) techniques. Data were taken from NASA Exoplanet Archive on 20 April 2022. The planets are shown as a function of their incident stellar flux and the effective temperature of their host star. The size of the symbols is proportional to the planetary radius, estimated from the mass using the probabilistic mass-radius relationship of Chen & Kipping (2017) when it is unknown (for non-transiting RV planets). LP 890-9 b and c are shown as orange circles. The inner (Recent Venus) and outer (Early Mars) boundaries of the empirical (optimistic) HZ are shown as solid red and blue lines, respectively (Kopparapu et al. 2014 and Sect. 8.3). The dashed green line shows an alternative conservative inner edge limit from 3D models (Leconte et al. 2013). The outer edge of the HZ in 3D models agrees with incident stellar flux for Early Mars insulation. We note that the three limits shown do vary with the stellar effective temperature, but this is not obvious on this plot due to the log-scale of the x-axis.
Current usage metrics show cumulative count of Article Views (full-text article views including HTML views, PDF and ePub downloads, according to the available data) and Abstracts Views on Vision4Press platform.
Data correspond to usage on the plateform after 2015. The current usage metrics is available 48-96 hours after online publication and is updated daily on week days.
Initial download of the metrics may take a while.