Fig. 16
Download original image
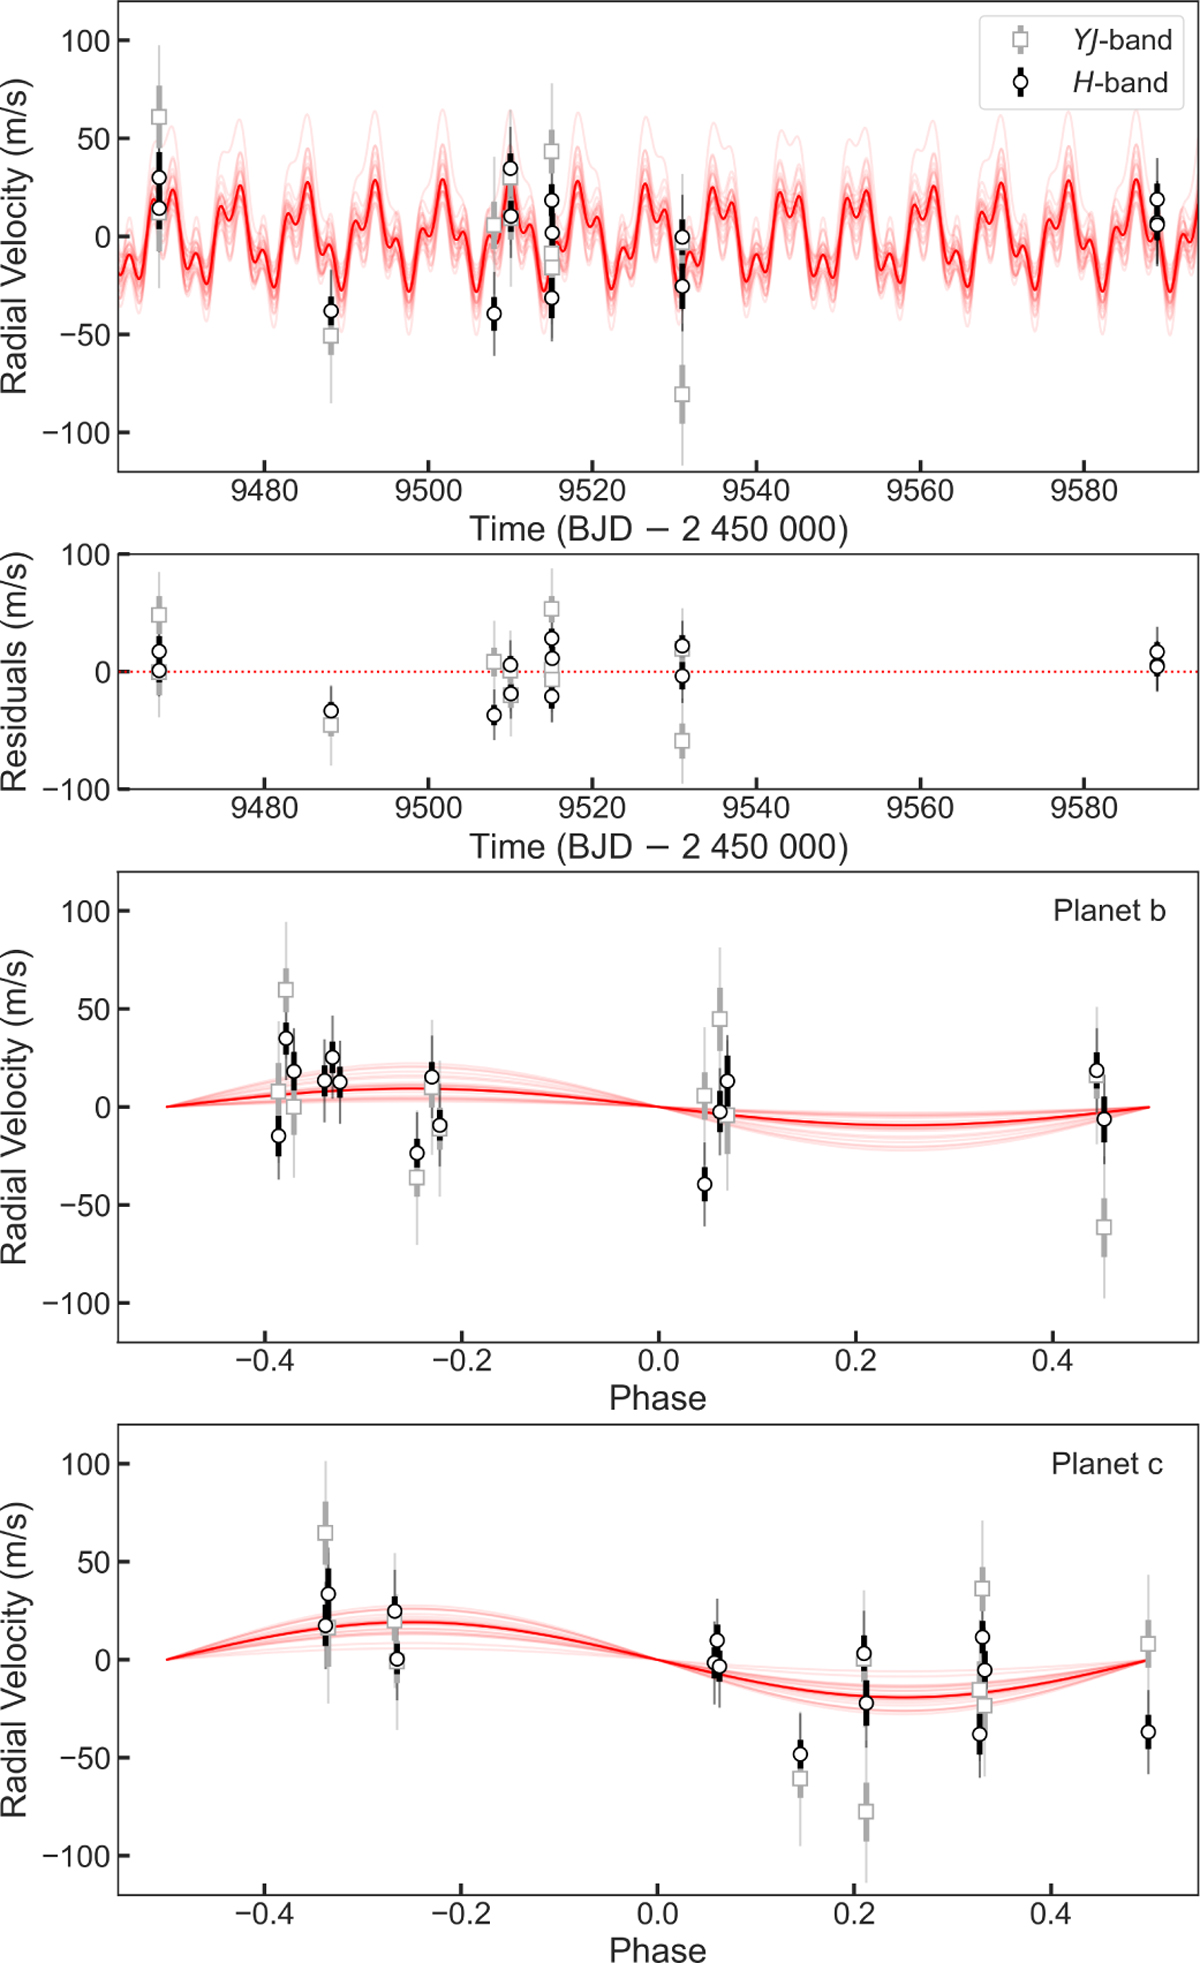
Subaru/IRD radial velocities obtained in the YJ- (grey squares) and H- (black circles) bands. The data are plotted with both their original error bars (thick solid lines) and the error bars enlarged by the best-fit jitter terms (thinner transparent lines). The top panel displays the data as a function of time. The solid red line shows the 2-planet model generated from the posterior median, while semi-transparent red lines show 25 models randomly drawn from the posteriors. The residuals around the median solution are shown in the second panel. The two lower panels show the data folded on the orbital periods of planets b and c, respectively, after removing the RV component from the other planet.
Current usage metrics show cumulative count of Article Views (full-text article views including HTML views, PDF and ePub downloads, according to the available data) and Abstracts Views on Vision4Press platform.
Data correspond to usage on the plateform after 2015. The current usage metrics is available 48-96 hours after online publication and is updated daily on week days.
Initial download of the metrics may take a while.