Fig. 13
Download original image
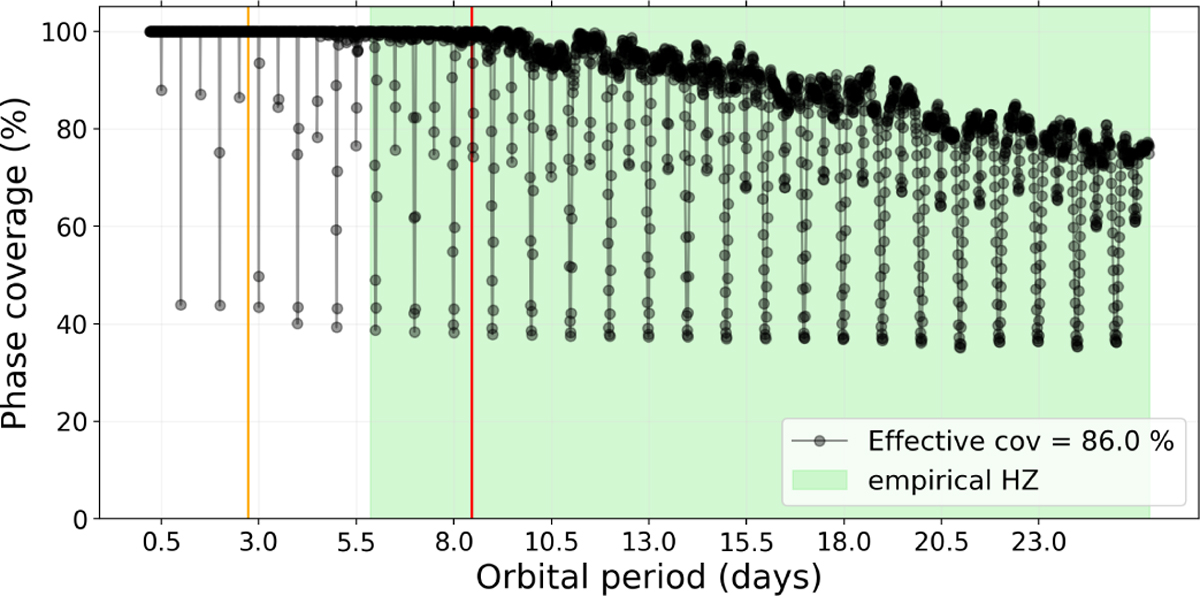
Phase coverage as a function of the orbital period using all photometric data obtained with SSO for LP 890-9. The effective coverage of 86% is the integral of the black curve. The orbital periods of planets b and c are shown as orange and red lines, respectively. The figure also shows the empirical (optimistic) HZ in green, i.e. the region between the ‘Recent Venus’ and ‘Early Mars’ limits (Kopparapu et al. 2013, 2014, and Sect. 8.3).
Current usage metrics show cumulative count of Article Views (full-text article views including HTML views, PDF and ePub downloads, according to the available data) and Abstracts Views on Vision4Press platform.
Data correspond to usage on the plateform after 2015. The current usage metrics is available 48-96 hours after online publication and is updated daily on week days.
Initial download of the metrics may take a while.