Fig. 12
Download original image
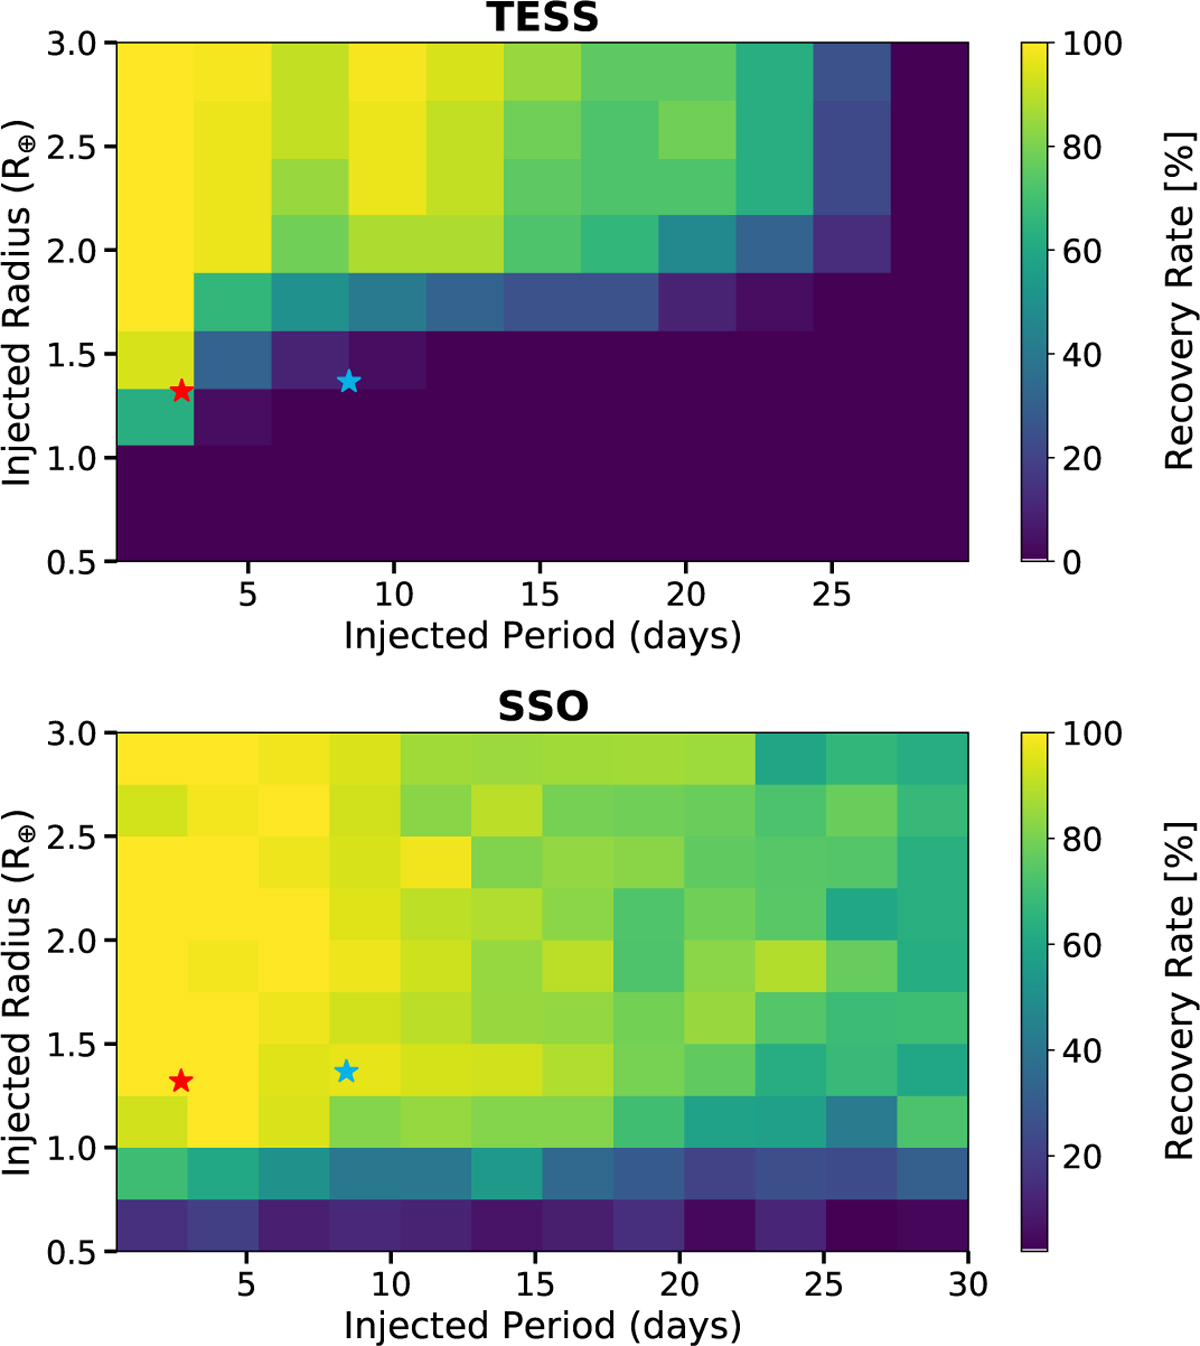
Results from the transit injection-and-recovery tests performed on the TESS (upper panel) and SSO (lower panel) data to assess the detectability of transiting planets in the LP 890-9 system. Upper panel: we explored a total of 3600 different scenarios. Each pixel evaluated 32 scenarios, that is, 32 light curves with injected planets having different P, Rp, and T0. Larger recovery rates are presented in yellow and green, while lower recovery rates are shown in blue and darker hues. LP 890-9 b (recovery rate ~60%) and c (recovery rate ~6%) are displayed as red and blue stars, respectively (see Sect. 5.2.1 for details). Lower panel: we injected 6000 artificial planets into the combined I + z-filter SSO light curve. On average, each box in this plot contains 50 injection scenarios with differing P, Rp, ip, and ϕ. Similarly to the upper panel, we include LP 890-9 b (recovery rate of 100%) and c (recovery rate of 96%) as red and blue stars, respectively (see Sect. 5.2.2 for details).
Current usage metrics show cumulative count of Article Views (full-text article views including HTML views, PDF and ePub downloads, according to the available data) and Abstracts Views on Vision4Press platform.
Data correspond to usage on the plateform after 2015. The current usage metrics is available 48-96 hours after online publication and is updated daily on week days.
Initial download of the metrics may take a while.