Fig. 10
Download original image
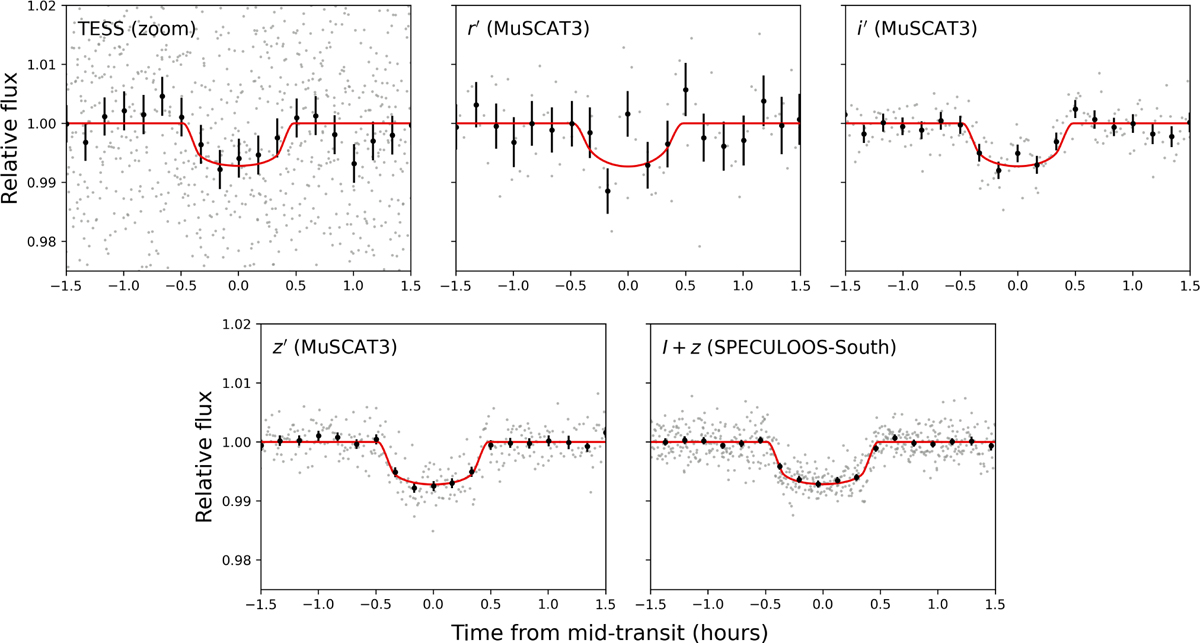
Phase-folded detrended transit photometry of LP 890-9 c in each observed bandpass. The unbinned data points are shown in grey, while the black circles with error bars correspond to 10-min bins. The best-fit transit model is shown in red, with a different limb darkening for each bandpass. We note that the MuSCAT3 r′- and i′- light curves show a possible hump around mid-transit which could be related to spot crossing.
Current usage metrics show cumulative count of Article Views (full-text article views including HTML views, PDF and ePub downloads, according to the available data) and Abstracts Views on Vision4Press platform.
Data correspond to usage on the plateform after 2015. The current usage metrics is available 48-96 hours after online publication and is updated daily on week days.
Initial download of the metrics may take a while.