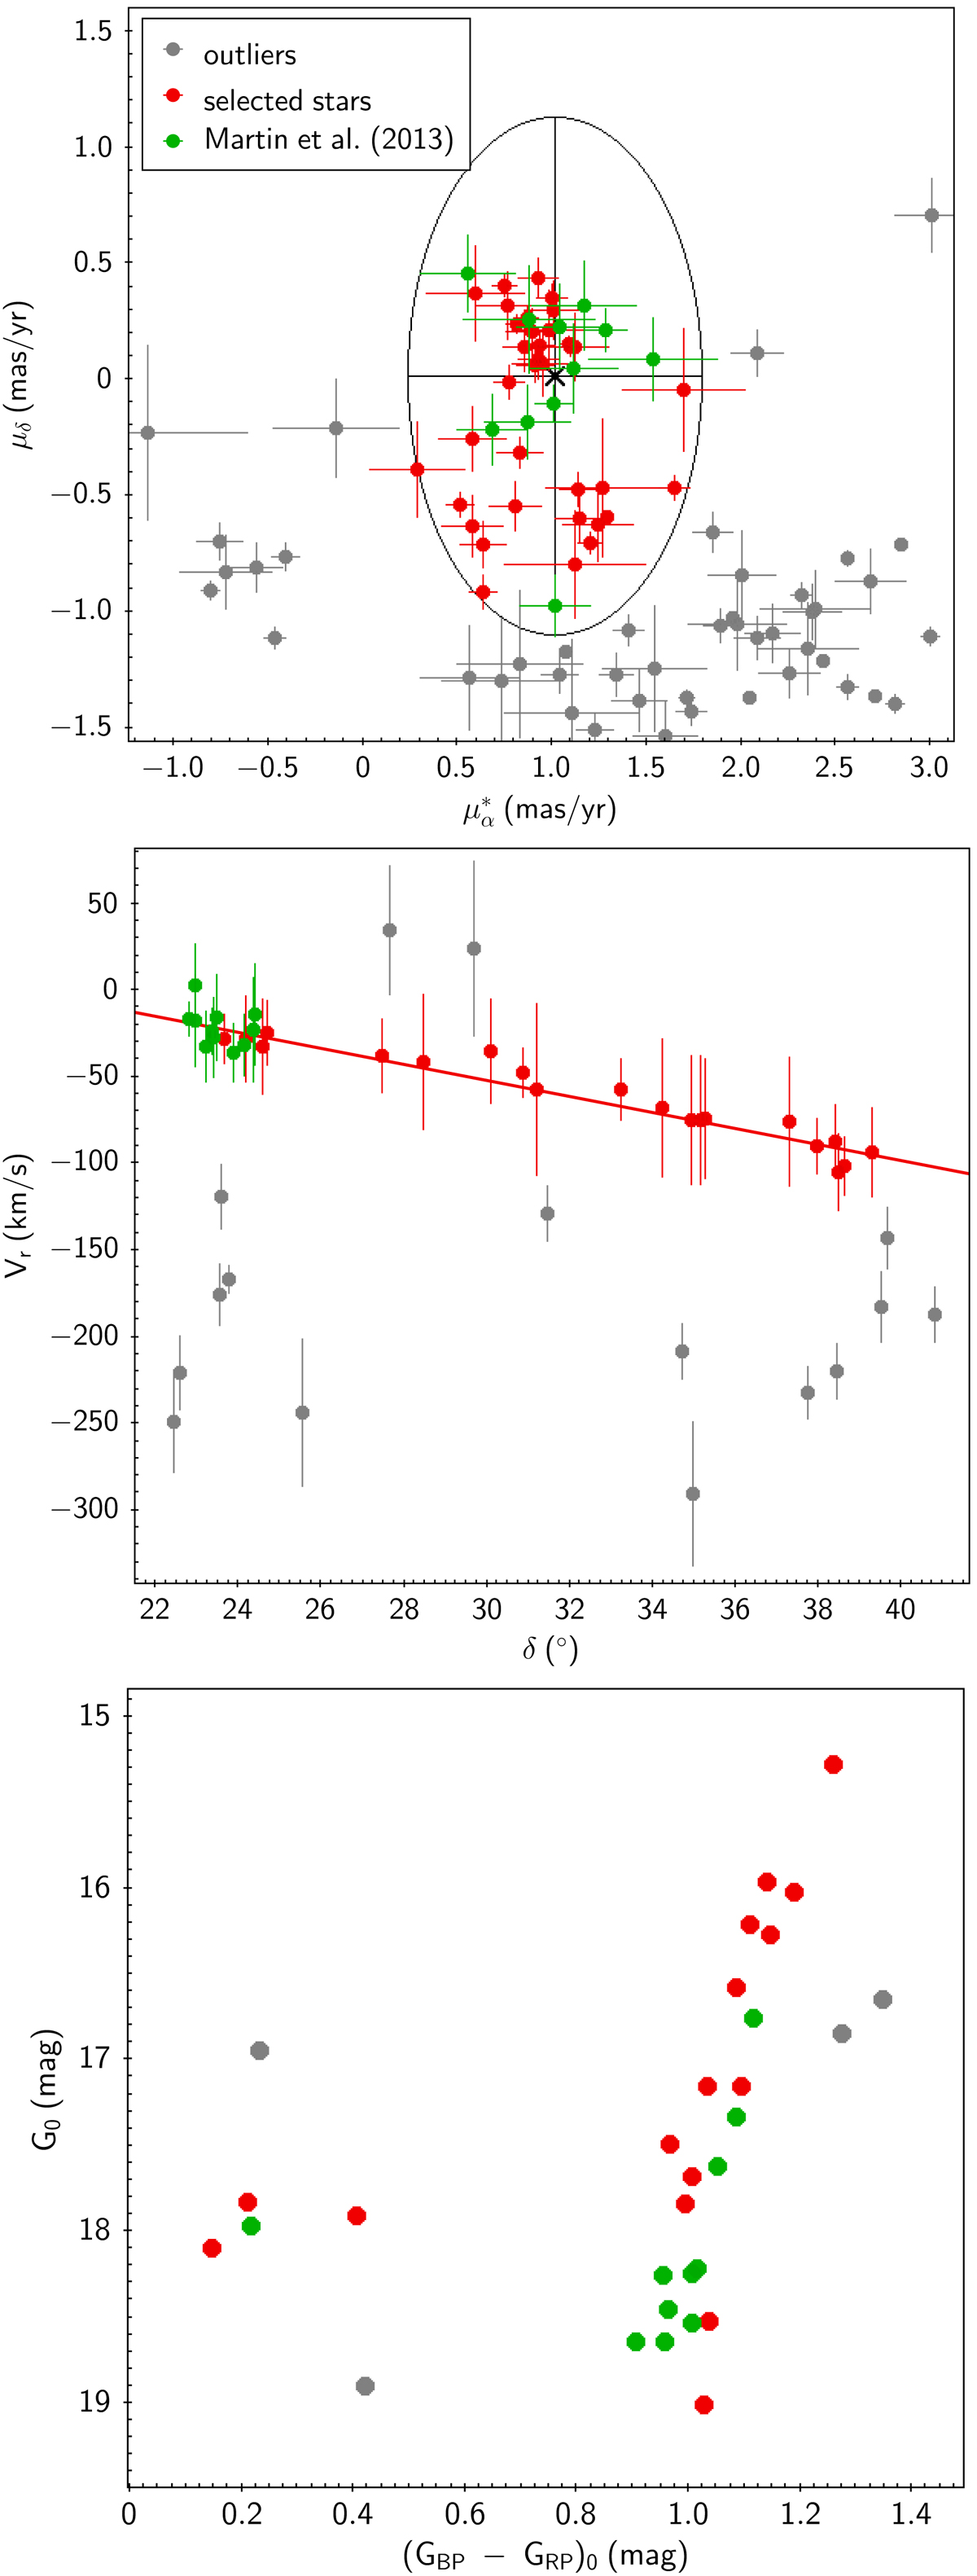
Fig. 2.
Download original image
Selections of Triangulum member stars. The gray dots represent rejected stars and the red dots represent the selected stars during each step. The member candidates identified by Martin et al. (2013) are marked by the green points. Top panel: local region of the overdensity in PM space, where the ellipse is defined to select member candidates in this step. Middle panel: stars in δ − Vr plane, where the error bars represent three times the uncertainties of Vr, and the red line is a linear fit to the stream sequence. Bottom panel: those candidates in a CMD.
Current usage metrics show cumulative count of Article Views (full-text article views including HTML views, PDF and ePub downloads, according to the available data) and Abstracts Views on Vision4Press platform.
Data correspond to usage on the plateform after 2015. The current usage metrics is available 48-96 hours after online publication and is updated daily on week days.
Initial download of the metrics may take a while.