Fig. 10.
Download original image
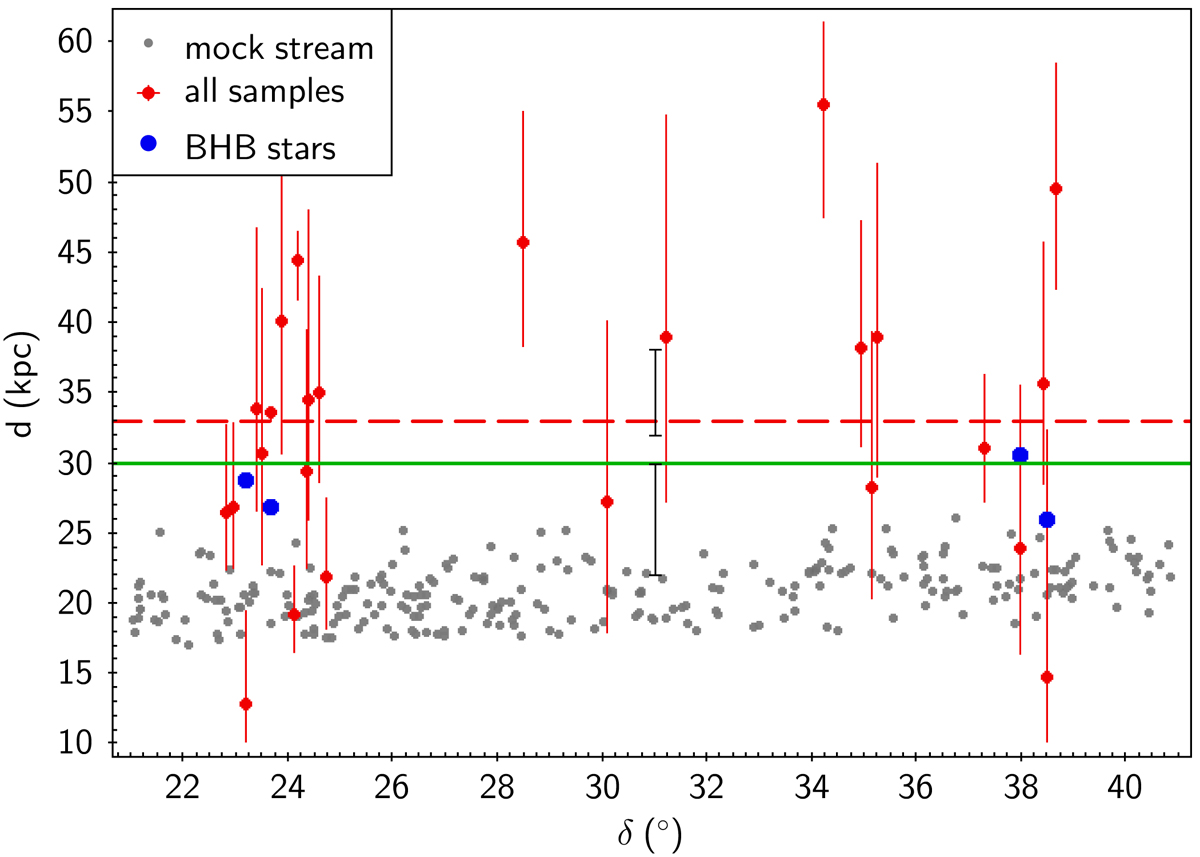
Heliocentric distance as a function of δ. The gray dots represent the stream particles. The blue points represent the four BHB stars in our samples, whose distances come from Xue et al. (2011). The red dots and error bars represent distances and corresponding errors for all member stars estimated using the method of Carlin et al. (2015). The dashed red line corresponds to their median value, 33 kpc. The solid green line marks the adopted distance, 30 kpc. Two black error bars represent 26 ± 4 kpc (Bonaca et al. 2012) and 35 ± 3 kpc (Martin et al. 2013).
Current usage metrics show cumulative count of Article Views (full-text article views including HTML views, PDF and ePub downloads, according to the available data) and Abstracts Views on Vision4Press platform.
Data correspond to usage on the plateform after 2015. The current usage metrics is available 48-96 hours after online publication and is updated daily on week days.
Initial download of the metrics may take a while.