Fig. 6
Download original image
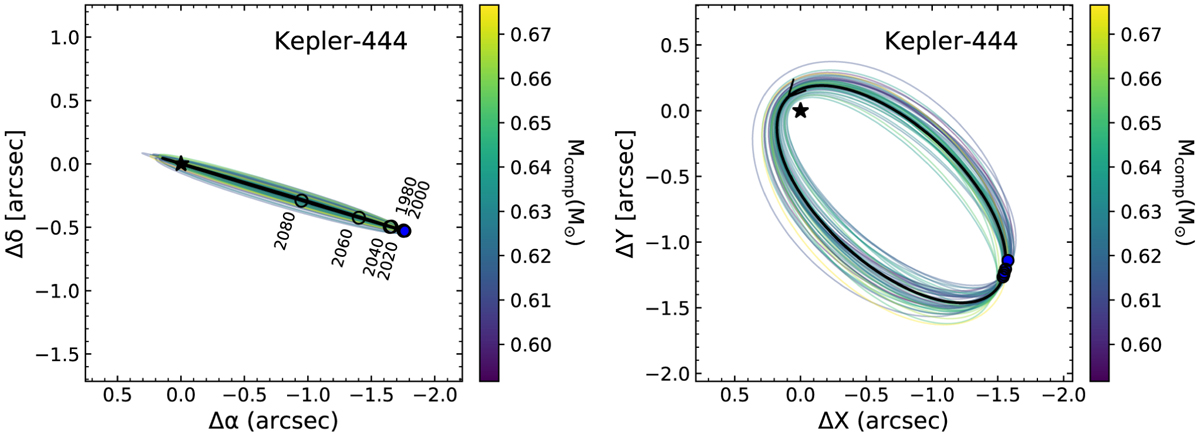
Left: best-fit orbital solution (thick line) and 50 draws from the posterior distribution (thin, coloured lines) for the Kepler-444 A-BC system, presented in the plane of the sky. Blue points indicate the observed relative astrometry of Kepler-444 BC, while open circles indicate predicted on-sky locations of the companion between 1980 and 2080. Right: same orbital solutions, presented in a top-down view. The observed astrometry is also deprojected into this view, using the inclination of the best-fit orbit. An arrow indicates the direction of this orbit. The colour bar indicates the total mass of the secondary component (i.e. MB+MC), and applies to both panels.
Current usage metrics show cumulative count of Article Views (full-text article views including HTML views, PDF and ePub downloads, according to the available data) and Abstracts Views on Vision4Press platform.
Data correspond to usage on the plateform after 2015. The current usage metrics is available 48-96 hours after online publication and is updated daily on week days.
Initial download of the metrics may take a while.